DjUs DSIP full analysis,charts,indicators,moving averages,SMA,DMA,EMA,ADX,MACD,RSIDj Us DSIP WideScreen charts, DMA,SMA,EMA technical analysis, forecast prediction, by indicators ADX,MACD,RSI,CCI INDICES stock exchange
Daily price and charts and targets DjUs Strong Daily Stock price targets for DjUs DSIP are 1837.29 and 1856.54 | Daily Target 1 | 1832.87 | | Daily Target 2 | 1841.7 | | Daily Target 3 | 1852.1233333333 | | Daily Target 4 | 1860.95 | | Daily Target 5 | 1871.37 |
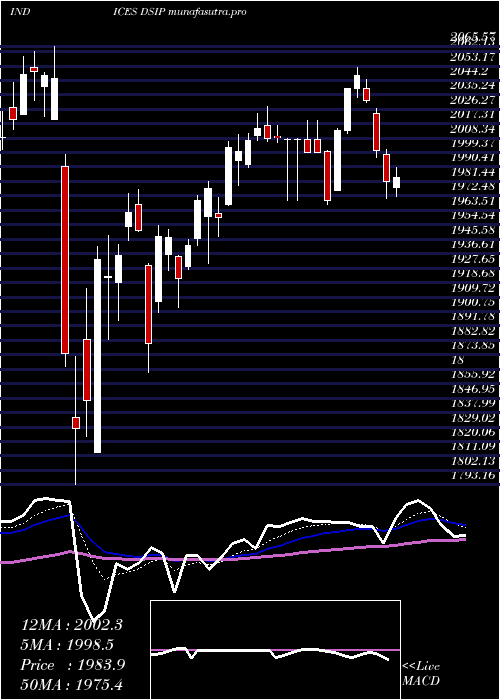
Daily price and volume Dj Us
| Date |
Closing |
Open |
Range |
Volume |
Mon 20 October 2025 |
1850.52 (-0.39%) |
1860.11 |
1843.30 - 1862.55 |
0.9137 times |
Fri 17 October 2025 |
1857.68 (0.74%) |
1846.12 |
1846.12 - 1860.82 |
1.2343 times |
Thu 16 October 2025 |
1844.07 (-3.11%) |
1863.32 |
1839.13 - 1868.54 |
1.5852 times |
Wed 15 October 2025 |
1903.25 (-3.12%) |
1931.26 |
1885.78 - 1931.65 |
1.4056 times |
Tue 14 October 2025 |
1964.51 (1.4%) |
1942.42 |
1940.93 - 1965.77 |
0.7729 times |
Mon 13 October 2025 |
1937.36 (-0.32%) |
1936.94 |
1928.03 - 1947.12 |
0.6958 times |
Fri 10 October 2025 |
1943.51 (-1%) |
1972.21 |
1942.59 - 1974.37 |
0.9433 times |
Thu 09 October 2025 |
1963.18 (-1.22%) |
1991.20 |
1958.84 - 1995.45 |
0.8208 times |
Wed 08 October 2025 |
1987.34 (-0.27%) |
1995.71 |
1986.37 - 2000.67 |
0.7053 times |
Tue 07 October 2025 |
1992.75 (0.94%) |
1978.39 |
1977.67 - 1994.93 |
0.9229 times |
Mon 06 October 2025 |
1974.13 (-0.27%) |
1978.43 |
1966.78 - 1985.71 |
0.9379 times |
Weekly price and charts DjUs Strong weekly Stock price targets for DjUs DSIP are 1837.29 and 1856.54 | Weekly Target 1 | 1832.87 | | Weekly Target 2 | 1841.7 | | Weekly Target 3 | 1852.1233333333 | | Weekly Target 4 | 1860.95 | | Weekly Target 5 | 1871.37 |
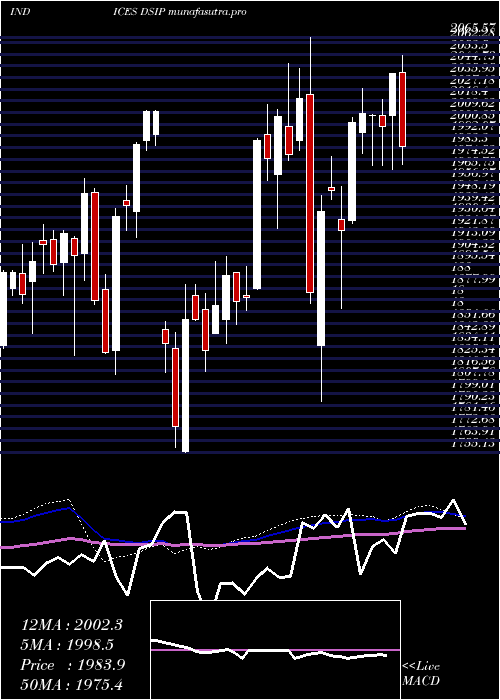
Weekly price and volumes for Dj Us
| Date |
Closing |
Open |
Range |
Volume |
Mon 20 October 2025 |
1850.52 (-0.39%) |
1860.11 |
1843.30 - 1862.55 |
0.2406 times |
Fri 17 October 2025 |
1857.68 (-4.42%) |
1936.94 |
1839.13 - 1965.77 |
1.4994 times |
Fri 10 October 2025 |
1943.51 (-1.82%) |
1978.43 |
1942.59 - 2000.67 |
1.1403 times |
Fri 03 October 2025 |
1979.52 (1.41%) |
1951.35 |
1936.24 - 1987.75 |
0.8744 times |
Fri 26 September 2025 |
1952.04 (1.49%) |
1916.15 |
1910.10 - 1960.22 |
1.1375 times |
Fri 19 September 2025 |
1923.37 (-1.46%) |
1951.16 |
1901.17 - 1953.32 |
1.794 times |
Fri 12 September 2025 |
1951.96 (0.81%) |
1933.30 |
1910.15 - 1963.10 |
1.1316 times |
Fri 05 September 2025 |
1936.29 (-0.43%) |
1945.44 |
1928.28 - 1971.60 |
0.9133 times |
Fri 29 August 2025 |
1944.66 (0%) |
1942.93 |
1940.33 - 1954.03 |
0.2004 times |
Fri 29 August 2025 |
1944.66 (-1.14%) |
1960.24 |
1927.97 - 1961.49 |
1.0684 times |
Fri 22 August 2025 |
1967.09 (1.98%) |
1923.27 |
1917.12 - 1985.21 |
1.1238 times |
Monthly price and charts DjUs Strong monthly Stock price targets for DjUs DSIP are 1764.06 and 1925.6 | Monthly Target 1 | 1735.23 | | Monthly Target 2 | 1792.88 | | Monthly Target 3 | 1896.7733333333 | | Monthly Target 4 | 1954.42 | | Monthly Target 5 | 2058.31 |
Monthly price and volumes Dj Us
| Date |
Closing |
Open |
Range |
Volume |
Mon 20 October 2025 |
1850.52 (-5.84%) |
1957.70 |
1839.13 - 2000.67 |
0.692 times |
Tue 30 September 2025 |
1965.31 (1.06%) |
1945.44 |
1901.17 - 1971.60 |
1.1227 times |
Fri 29 August 2025 |
1944.66 (3.52%) |
1877.91 |
1856.28 - 1985.21 |
1.0296 times |
Thu 31 July 2025 |
1878.59 (-5.41%) |
1979.67 |
1859.38 - 1990.71 |
1.2827 times |
Mon 30 June 2025 |
1986.11 (-2.61%) |
2027.37 |
1930.06 - 2062.59 |
1.0744 times |
Fri 30 May 2025 |
2039.43 (3.17%) |
1961.65 |
1947.02 - 2052.57 |
1.089 times |
Wed 30 April 2025 |
1976.86 (-3.46%) |
2052.61 |
1793.16 - 2065.57 |
1.0961 times |
Mon 31 March 2025 |
2047.79 (2.97%) |
1992.87 |
1922.49 - 2059.11 |
0.9323 times |
Fri 28 February 2025 |
1988.78 (6.65%) |
1854.34 |
1836.32 - 1990.04 |
0.7963 times |
Fri 31 January 2025 |
1864.86 (-7.23%) |
1846.86 |
1755.13 - 1897.66 |
0.8849 times |
Tue 26 November 2024 |
2010.22 (8.97%) |
1846.57 |
1812.96 - 2011.48 |
0.7369 times |

DMA SMA EMA moving averages of Dj Us DSIP
DMA (daily moving average) of Dj Us DSIP
| DMA period | DMA value | | 5 day DMA | 1884.01 | | 12 day DMA | 1933.15 | | 20 day DMA | 1936.35 | | 35 day DMA | 1936.33 | | 50 day DMA | 1937.8 | | 100 day DMA | 1941.75 | | 150 day DMA | 1954.54 | | 200 day DMA | 1938.74 | EMA (exponential moving average) of Dj Us DSIP
| EMA period | EMA current | EMA prev | EMA prev2 | | 5 day EMA | 1877.6 | 1891.14 | 1907.87 | | 12 day EMA | 1910.56 | 1921.47 | 1933.06 | | 20 day EMA | 1923.11 | 1930.75 | 1938.44 | | 35 day EMA | 1930.25 | 1934.94 | 1939.49 | | 50 day EMA | 1928.95 | 1932.15 | 1935.19 |
SMA (simple moving average) of Dj Us DSIP
| SMA period | SMA current | SMA prev | SMA prev2 | | 5 day SMA | 1884.01 | 1901.37 | 1918.54 | | 12 day SMA | 1933.15 | 1942.03 | 1951 | | 20 day SMA | 1936.35 | 1939.99 | 1943.45 | | 35 day SMA | 1936.33 | 1939.02 | 1941.35 | | 50 day SMA | 1937.8 | 1938.99 | 1939.82 | | 100 day SMA | 1941.75 | 1943.26 | 1945 | | 150 day SMA | 1954.54 | 1955.37 | 1956.38 | | 200 day SMA | 1938.74 | 1939.15 | 1939.56 |
|
|
