US DSIO full analysis,charts,indicators,moving averages,SMA,DMA,EMA,ADX,MACD,RSIU S DSIO WideScreen charts, DMA,SMA,EMA technical analysis, forecast prediction, by indicators ADX,MACD,RSI,CCI INDICES stock exchange
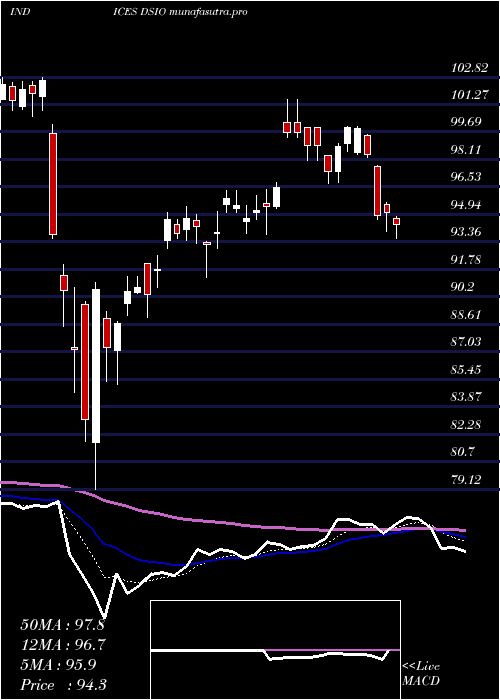
Daily price and charts and targets US Strong Daily Stock price targets for US DSIO are 109.15 and 110.77 | Daily Target 1 | 108.85 | | Daily Target 2 | 109.44 | | Daily Target 3 | 110.47333333333 | | Daily Target 4 | 111.06 | | Daily Target 5 | 112.09 |
Daily price and volume U S
| Date |
Closing |
Open |
Range |
Volume |
Thu 04 December 2025 |
110.02 (-0.64%) |
110.71 |
109.89 - 111.51 |
0.9433 times |
Wed 03 December 2025 |
110.73 (0.02%) |
110.50 |
109.97 - 111.05 |
0.9459 times |
Tue 02 December 2025 |
110.71 (-0.21%) |
111.08 |
110.37 - 111.48 |
1.0449 times |
Mon 01 December 2025 |
110.94 (0.12%) |
110.22 |
110.11 - 111.58 |
0.8744 times |
Fri 28 November 2025 |
110.81 (0.11%) |
110.74 |
110.62 - 111.44 |
0.3846 times |
Wed 26 November 2025 |
110.69 (0.55%) |
110.11 |
109.81 - 111.60 |
0.7594 times |
Tue 25 November 2025 |
110.09 (1.16%) |
108.96 |
108.95 - 110.83 |
1.1804 times |
Mon 24 November 2025 |
108.83 (0.54%) |
108.66 |
107.90 - 109.36 |
1.6068 times |
Fri 21 November 2025 |
108.25 (2.13%) |
106.47 |
105.97 - 108.59 |
1.3536 times |
Thu 20 November 2025 |
105.99 (0.07%) |
106.74 |
105.98 - 108.20 |
0.9067 times |
Wed 19 November 2025 |
105.92 (-0.99%) |
107.11 |
105.07 - 107.36 |
1.3705 times |
Weekly price and charts US Strong weekly Stock price targets for US DSIO are 109.11 and 110.8 | Weekly Target 1 | 108.81 | | Weekly Target 2 | 109.41 | | Weekly Target 3 | 110.49666666667 | | Weekly Target 4 | 111.1 | | Weekly Target 5 | 112.19 |
Weekly price and volumes for U S
| Date |
Closing |
Open |
Range |
Volume |
Thu 04 December 2025 |
110.02 (-0.71%) |
110.22 |
109.89 - 111.58 |
0.8654 times |
Fri 28 November 2025 |
110.81 (2.36%) |
108.66 |
107.90 - 111.60 |
0.8933 times |
Fri 21 November 2025 |
108.25 (1.56%) |
106.96 |
105.07 - 108.59 |
1.3017 times |
Fri 14 November 2025 |
106.59 (-2.41%) |
109.18 |
106.49 - 109.66 |
1.1236 times |
Fri 07 November 2025 |
109.22 (0.89%) |
107.91 |
106.98 - 109.22 |
1.0155 times |
Fri 31 October 2025 |
108.26 (0%) |
107.44 |
107.13 - 108.83 |
0.2437 times |
Fri 31 October 2025 |
108.26 (-1.98%) |
110.65 |
106.85 - 111.11 |
1.1517 times |
Fri 24 October 2025 |
110.45 (1.36%) |
109.12 |
109.09 - 111.12 |
0.9833 times |
Fri 17 October 2025 |
108.97 (9.32%) |
99.98 |
99.98 - 109.49 |
1.3387 times |
Fri 10 October 2025 |
99.68 (-4.93%) |
105.27 |
99.60 - 105.53 |
1.0831 times |
Fri 03 October 2025 |
104.85 (2.25%) |
102.69 |
101.52 - 105.65 |
0.9976 times |
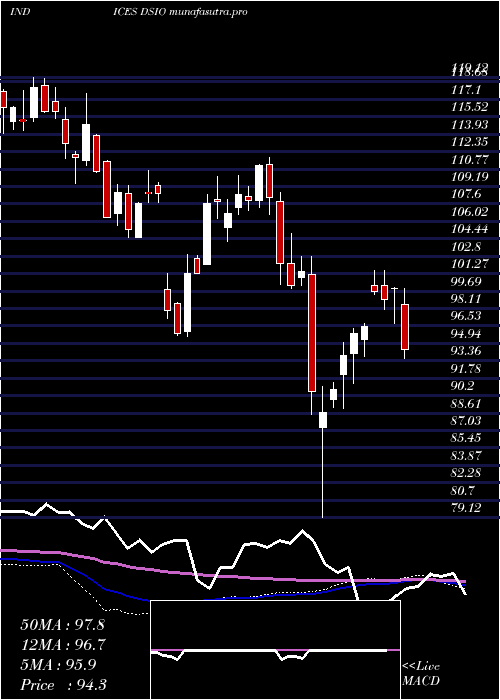
Monthly price and charts US Strong monthly Stock price targets for US DSIO are 109.11 and 110.8 | Monthly Target 1 | 108.81 | | Monthly Target 2 | 109.41 | | Monthly Target 3 | 110.49666666667 | | Monthly Target 4 | 111.1 | | Monthly Target 5 | 112.19 |
Monthly price and volumes U S
| Date |
Closing |
Open |
Range |
Volume |
Thu 04 December 2025 |
110.02 (-0.71%) |
110.22 |
109.89 - 111.58 |
0.2016 times |
Fri 28 November 2025 |
110.81 (2.36%) |
107.91 |
105.07 - 111.60 |
1.0096 times |
Fri 31 October 2025 |
108.26 (5.32%) |
102.83 |
99.60 - 111.12 |
1.2287 times |
Tue 30 September 2025 |
102.79 (0.03%) |
101.30 |
100.40 - 105.53 |
1.303 times |
Fri 29 August 2025 |
102.76 (6.44%) |
96.81 |
93.49 - 102.93 |
1.0447 times |
Thu 31 July 2025 |
96.54 (0.38%) |
95.69 |
95.62 - 102.08 |
1.0714 times |
Mon 30 June 2025 |
96.17 (-1.6%) |
97.14 |
94.71 - 101.13 |
0.9749 times |
Fri 30 May 2025 |
97.73 (4.85%) |
93.82 |
93.00 - 101.57 |
1.1895 times |
Wed 30 April 2025 |
93.21 (-8.73%) |
102.35 |
79.12 - 102.80 |
1.1303 times |
Mon 31 March 2025 |
102.13 (-8.07%) |
111.18 |
99.88 - 111.84 |
0.8462 times |
Fri 28 February 2025 |
111.09 (3%) |
105.45 |
104.20 - 111.17 |
0.8857 times |

DMA SMA EMA moving averages of U S DSIO
DMA (daily moving average) of U S DSIO
| DMA period | DMA value | | 5 day DMA | 110.64 | | 12 day DMA | 109.16 | | 20 day DMA | 108.68 | | 35 day DMA | 108.86 | | 50 day DMA | 107.17 | | 100 day DMA | 103.49 | | 150 day DMA | 101.49 | | 200 day DMA | 101.48 | EMA (exponential moving average) of U S DSIO
| EMA period | EMA current | EMA prev | EMA prev2 | | 5 day EMA | 110.32 | 110.47 | 110.34 | | 12 day EMA | 109.62 | 109.55 | 109.34 | | 20 day EMA | 109.07 | 108.97 | 108.78 | | 35 day EMA | 107.99 | 107.87 | 107.7 | | 50 day EMA | 107.19 | 107.07 | 106.92 |
SMA (simple moving average) of U S DSIO
| SMA period | SMA current | SMA prev | SMA prev2 | | 5 day SMA | 110.64 | 110.78 | 110.65 | | 12 day SMA | 109.16 | 108.88 | 108.53 | | 20 day SMA | 108.68 | 108.56 | 108.41 | | 35 day SMA | 108.86 | 108.8 | 108.58 | | 50 day SMA | 107.17 | 107.03 | 106.88 | | 100 day SMA | 103.49 | 103.38 | 103.24 | | 150 day SMA | 101.49 | 101.39 | 101.28 | | 200 day SMA | 101.48 | 101.47 | 101.45 |
|
|
