DjUs DSIN full analysis,charts,indicators,moving averages,SMA,DMA,EMA,ADX,MACD,RSIDj Us DSIN WideScreen charts, DMA,SMA,EMA technical analysis, forecast prediction, by indicators ADX,MACD,RSI,CCI INDICES stock exchange
Daily price and charts and targets DjUs Strong Daily Stock price targets for DjUs DSIN are 1431.34 and 1441.33 | Daily Target 1 | 1428.83 | | Daily Target 2 | 1433.85 | | Daily Target 3 | 1438.8166666667 | | Daily Target 4 | 1443.84 | | Daily Target 5 | 1448.81 |
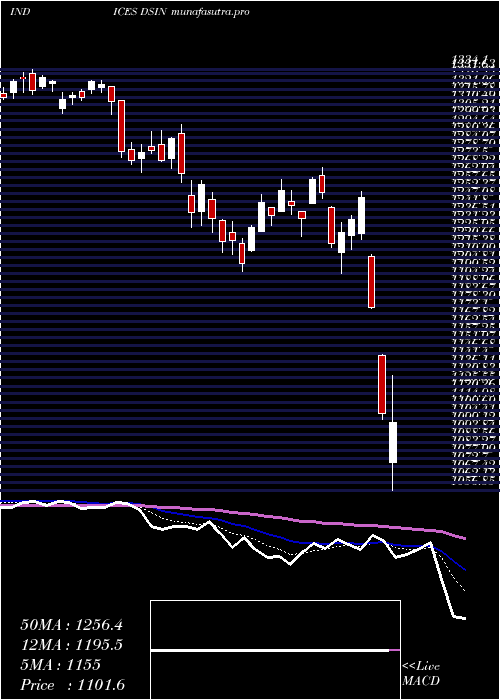
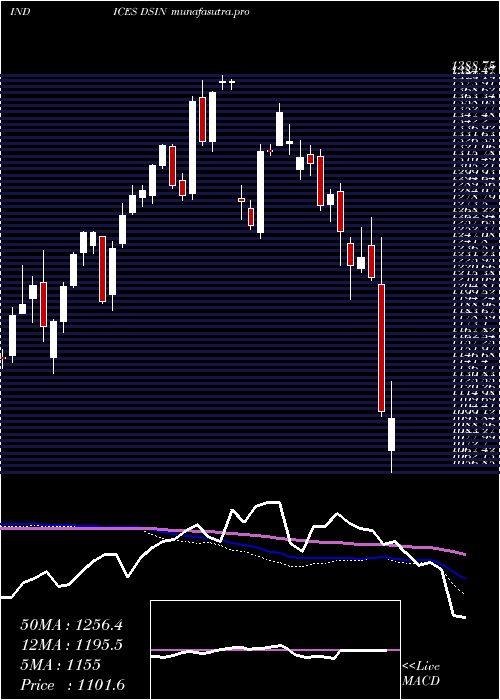
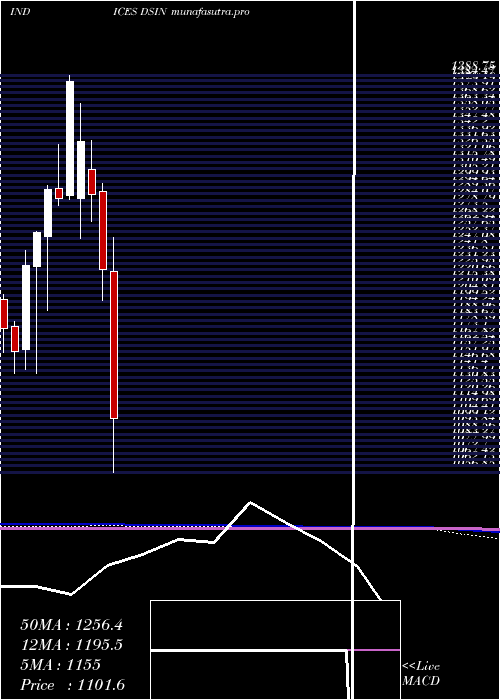
Daily price and volume Dj Us
| Date |
Closing |
Open |
Range |
Volume |
Fri 05 December 2025 |
1438.88 (-0.19%) |
1441.78 |
1433.79 - 1443.78 |
0.975 times |
Thu 04 December 2025 |
1441.56 (0.66%) |
1432.01 |
1431.84 - 1446.64 |
1.0878 times |
Wed 03 December 2025 |
1432.15 (0.88%) |
1419.29 |
1416.27 - 1432.53 |
1.0441 times |
Tue 02 December 2025 |
1419.59 (0.55%) |
1421.18 |
1413.64 - 1424.00 |
0.9936 times |
Mon 01 December 2025 |
1411.80 (-1.19%) |
1424.09 |
1411.23 - 1425.85 |
0.9211 times |
Fri 28 November 2025 |
1428.85 (0.62%) |
1421.85 |
1420.42 - 1430.89 |
0.4423 times |
Wed 26 November 2025 |
1420.01 (0.57%) |
1412.90 |
1412.90 - 1427.52 |
0.8563 times |
Tue 25 November 2025 |
1412.02 (1.54%) |
1394.23 |
1386.52 - 1414.35 |
1.0283 times |
Mon 24 November 2025 |
1390.59 (0.58%) |
1383.69 |
1379.79 - 1395.68 |
1.4428 times |
Fri 21 November 2025 |
1382.53 (1.52%) |
1364.11 |
1357.74 - 1389.30 |
1.2087 times |
Thu 20 November 2025 |
1361.78 (-1.77%) |
1404.65 |
1360.68 - 1409.30 |
1.1527 times |
Weekly price and charts DjUs Strong weekly Stock price targets for DjUs DSIN are 1425.06 and 1460.47 | Weekly Target 1 | 1396.84 | | Weekly Target 2 | 1417.86 | | Weekly Target 3 | 1432.25 | | Weekly Target 4 | 1453.27 | | Weekly Target 5 | 1467.66 |
Weekly price and volumes for Dj Us
| Date |
Closing |
Open |
Range |
Volume |
Fri 05 December 2025 |
1438.88 (0.7%) |
1424.09 |
1411.23 - 1446.64 |
1.114 times |
Fri 28 November 2025 |
1428.85 (3.35%) |
1383.69 |
1379.79 - 1430.89 |
0.8363 times |
Fri 21 November 2025 |
1382.53 (-1.44%) |
1400.52 |
1357.74 - 1409.30 |
1.1964 times |
Fri 14 November 2025 |
1402.66 (-1.5%) |
1433.06 |
1391.10 - 1444.90 |
1.0871 times |
Fri 07 November 2025 |
1424.07 (-1.28%) |
1417.21 |
1401.58 - 1434.58 |
1.0359 times |
Fri 31 October 2025 |
1442.55 (0%) |
1437.49 |
1433.71 - 1447.18 |
0.2707 times |
Fri 31 October 2025 |
1442.55 (-0.55%) |
1460.07 |
1433.71 - 1464.73 |
1.398 times |
Fri 24 October 2025 |
1450.58 (2.67%) |
1417.47 |
1417.47 - 1460.81 |
0.9866 times |
Fri 17 October 2025 |
1412.84 (1.34%) |
1400.48 |
1394.73 - 1441.34 |
1.0506 times |
Fri 10 October 2025 |
1394.12 (-2.75%) |
1440.41 |
1394.12 - 1449.81 |
1.0244 times |
Fri 03 October 2025 |
1433.53 (1.6%) |
1421.89 |
1412.04 - 1443.00 |
0.8378 times |
Monthly price and charts DjUs Strong monthly Stock price targets for DjUs DSIN are 1425.06 and 1460.47 | Monthly Target 1 | 1396.84 | | Monthly Target 2 | 1417.86 | | Monthly Target 3 | 1432.25 | | Monthly Target 4 | 1453.27 | | Monthly Target 5 | 1467.66 |
Monthly price and volumes Dj Us
| Date |
Closing |
Open |
Range |
Volume |
Fri 05 December 2025 |
1438.88 (0.7%) |
1424.09 |
1411.23 - 1446.64 |
0.2661 times |
Fri 28 November 2025 |
1428.85 (-0.95%) |
1417.21 |
1357.74 - 1444.90 |
0.9927 times |
Fri 31 October 2025 |
1442.55 (0.99%) |
1425.10 |
1394.12 - 1464.73 |
1.2269 times |
Tue 30 September 2025 |
1428.45 (1.28%) |
1390.65 |
1382.81 - 1432.41 |
1.0827 times |
Fri 29 August 2025 |
1410.38 (-0.01%) |
1399.34 |
1373.26 - 1428.19 |
1.0601 times |
Thu 31 July 2025 |
1410.48 (3.08%) |
1365.45 |
1363.09 - 1438.46 |
1.0397 times |
Mon 30 June 2025 |
1368.40 (3.6%) |
1317.83 |
1300.30 - 1370.03 |
0.9848 times |
Fri 30 May 2025 |
1320.85 (8.12%) |
1229.51 |
1223.14 - 1334.95 |
1.2286 times |
Wed 30 April 2025 |
1221.63 (-0.38%) |
1224.27 |
1056.85 - 1253.31 |
1.1635 times |
Mon 31 March 2025 |
1226.29 (-4.84%) |
1291.62 |
1199.87 - 1297.96 |
0.9548 times |
Fri 28 February 2025 |
1288.63 (-3.34%) |
1309.92 |
1266.04 - 1334.10 |
0.9686 times |
DMA SMA EMA moving averages of Dj Us DSIN
DMA (daily moving average) of Dj Us DSIN
| DMA period | DMA value | | 5 day DMA | 1428.8 | | 12 day DMA | 1410.51 | | 20 day DMA | 1411.23 | | 35 day DMA | 1422.14 | | 50 day DMA | 1422.08 | | 100 day DMA | 1414.46 | | 150 day DMA | 1384.94 | | 200 day DMA | 1347.66 | EMA (exponential moving average) of Dj Us DSIN
| EMA period | EMA current | EMA prev | EMA prev2 | | 5 day EMA | 1431.18 | 1427.33 | 1420.22 | | 12 day EMA | 1420.54 | 1417.21 | 1412.78 | | 20 day EMA | 1418 | 1415.8 | 1413.09 | | 35 day EMA | 1417.91 | 1416.68 | 1415.21 | | 50 day EMA | 1422.47 | 1421.8 | 1420.99 |
SMA (simple moving average) of Dj Us DSIN
| SMA period | SMA current | SMA prev | SMA prev2 | | 5 day SMA | 1428.8 | 1426.79 | 1422.48 | | 12 day SMA | 1410.51 | 1405.5 | 1400.81 | | 20 day SMA | 1411.23 | 1410.16 | 1409.48 | | 35 day SMA | 1422.14 | 1421.39 | 1420.82 | | 50 day SMA | 1422.08 | 1421.5 | 1421.07 | | 100 day SMA | 1414.46 | 1413.94 | 1413.48 | | 150 day SMA | 1384.94 | 1383.5 | 1381.99 | | 200 day SMA | 1347.66 | 1347.1 | 1346.52 |
|
|
