DjUs DSIL full analysis,charts,indicators,moving averages,SMA,DMA,EMA,ADX,MACD,RSIDj Us DSIL WideScreen charts, DMA,SMA,EMA technical analysis, forecast prediction, by indicators ADX,MACD,RSI,CCI INDICES stock exchange
Daily price and charts and targets DjUs Strong Daily Stock price targets for DjUs DSIL are 1270.54 and 1281.27 | Daily Target 1 | 1262.77 | | Daily Target 2 | 1267.58 | | Daily Target 3 | 1273.5 | | Daily Target 4 | 1278.31 | | Daily Target 5 | 1284.23 |
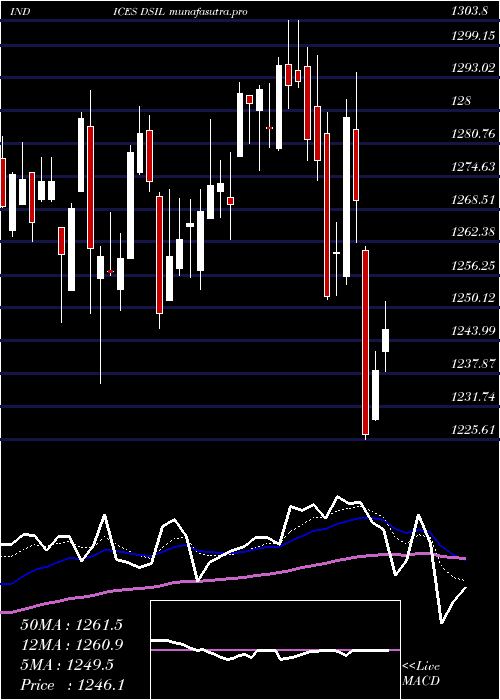
Daily price and volume Dj Us
| Date |
Closing |
Open |
Range |
Volume |
Thu 04 December 2025 |
1272.39 (0.32%) |
1272.27 |
1268.69 - 1279.42 |
1.0362 times |
Wed 03 December 2025 |
1268.34 (0.98%) |
1254.59 |
1253.76 - 1268.74 |
1.012 times |
Tue 02 December 2025 |
1256.03 (-0.47%) |
1266.00 |
1253.00 - 1266.17 |
0.877 times |
Mon 01 December 2025 |
1261.90 (-0.51%) |
1265.64 |
1260.38 - 1275.41 |
0.8854 times |
Fri 28 November 2025 |
1268.32 (0.01%) |
1267.96 |
1267.96 - 1277.79 |
0.4254 times |
Wed 26 November 2025 |
1268.23 (-0.22%) |
1270.41 |
1268.02 - 1277.94 |
0.9281 times |
Tue 25 November 2025 |
1270.98 (0.98%) |
1266.31 |
1266.31 - 1278.18 |
1.0251 times |
Mon 24 November 2025 |
1258.65 (-0.02%) |
1255.71 |
1246.00 - 1259.92 |
1.6595 times |
Fri 21 November 2025 |
1258.84 (1.28%) |
1248.38 |
1242.67 - 1269.01 |
1.1714 times |
Thu 20 November 2025 |
1242.90 (0.08%) |
1251.75 |
1236.99 - 1265.22 |
0.9799 times |
Wed 19 November 2025 |
1241.89 (-0.59%) |
1243.39 |
1230.17 - 1249.25 |
0.9865 times |
Weekly price and charts DjUs Strong weekly Stock price targets for DjUs DSIL are 1262.7 and 1289.12 | Weekly Target 1 | 1241.85 | | Weekly Target 2 | 1257.12 | | Weekly Target 3 | 1268.27 | | Weekly Target 4 | 1283.54 | | Weekly Target 5 | 1294.69 |
Weekly price and volumes for Dj Us
| Date |
Closing |
Open |
Range |
Volume |
Thu 04 December 2025 |
1272.39 (0.32%) |
1265.64 |
1253.00 - 1279.42 |
0.8965 times |
Fri 28 November 2025 |
1268.32 (0.75%) |
1255.71 |
1246.00 - 1278.18 |
0.95 times |
Fri 21 November 2025 |
1258.84 (-2.01%) |
1282.61 |
1230.17 - 1283.15 |
1.2718 times |
Fri 14 November 2025 |
1284.67 (1.04%) |
1269.42 |
1269.24 - 1303.41 |
1.1955 times |
Fri 07 November 2025 |
1271.40 (1.21%) |
1248.99 |
1248.00 - 1285.54 |
1.3204 times |
Fri 31 October 2025 |
1256.14 (0%) |
1242.25 |
1237.67 - 1259.02 |
0.2968 times |
Fri 31 October 2025 |
1256.14 (0.96%) |
1248.12 |
1232.89 - 1260.16 |
1.2046 times |
Fri 24 October 2025 |
1244.17 (0.47%) |
1241.98 |
1236.82 - 1256.16 |
0.8674 times |
Fri 17 October 2025 |
1238.41 (-1.1%) |
1260.21 |
1225.61 - 1293.97 |
1.041 times |
Fri 10 October 2025 |
1252.16 (-3.33%) |
1295.51 |
1251.66 - 1303.80 |
0.956 times |
Fri 03 October 2025 |
1295.34 (0.41%) |
1289.80 |
1275.75 - 1296.86 |
0.892 times |

Monthly price and charts DjUs Strong monthly Stock price targets for DjUs DSIL are 1262.7 and 1289.12 | Monthly Target 1 | 1241.85 | | Monthly Target 2 | 1257.12 | | Monthly Target 3 | 1268.27 | | Monthly Target 4 | 1283.54 | | Monthly Target 5 | 1294.69 |
Monthly price and volumes Dj Us
| Date |
Closing |
Open |
Range |
Volume |
Thu 04 December 2025 |
1272.39 (0.32%) |
1265.64 |
1253.00 - 1279.42 |
0.1916 times |
Fri 28 November 2025 |
1268.32 (0.97%) |
1248.99 |
1230.17 - 1303.41 |
1.0127 times |
Fri 31 October 2025 |
1256.14 (-2.7%) |
1283.75 |
1225.61 - 1303.80 |
1.0272 times |
Tue 30 September 2025 |
1290.95 (1.35%) |
1265.15 |
1235.99 - 1292.16 |
1.1993 times |
Fri 29 August 2025 |
1273.78 (5.5%) |
1192.87 |
1165.04 - 1288.74 |
1.1063 times |
Thu 31 July 2025 |
1207.43 (-3.66%) |
1250.49 |
1181.28 - 1271.80 |
1.0376 times |
Mon 30 June 2025 |
1253.32 (2.12%) |
1219.57 |
1198.92 - 1254.63 |
0.9732 times |
Fri 30 May 2025 |
1227.30 (0.8%) |
1200.48 |
1195.58 - 1267.55 |
1.1379 times |
Wed 30 April 2025 |
1217.55 (-6.12%) |
1294.96 |
1078.13 - 1322.36 |
1.2508 times |
Mon 31 March 2025 |
1296.86 (-2.61%) |
1336.82 |
1232.85 - 1349.12 |
1.0634 times |
Fri 28 February 2025 |
1331.55 (1.12%) |
1290.99 |
1247.25 - 1332.10 |
1.0476 times |

DMA SMA EMA moving averages of Dj Us DSIL
DMA (daily moving average) of Dj Us DSIL
| DMA period | DMA value | | 5 day DMA | 1265.4 | | 12 day DMA | 1259.81 | | 20 day DMA | 1266.64 | | 35 day DMA | 1258.33 | | 50 day DMA | 1264.88 | | 100 day DMA | 1254.28 | | 150 day DMA | 1247 | | 200 day DMA | 1248.95 | EMA (exponential moving average) of Dj Us DSIL
| EMA period | EMA current | EMA prev | EMA prev2 | | 5 day EMA | 1266.58 | 1263.67 | 1261.34 | | 12 day EMA | 1264.51 | 1263.08 | 1262.12 | | 20 day EMA | 1263.86 | 1262.96 | 1262.39 | | 35 day EMA | 1265.01 | 1264.58 | 1264.36 | | 50 day EMA | 1265.04 | 1264.74 | 1264.59 |
SMA (simple moving average) of Dj Us DSIL
| SMA period | SMA current | SMA prev | SMA prev2 | | 5 day SMA | 1265.4 | 1264.56 | 1265.09 | | 12 day SMA | 1259.81 | 1257.94 | 1259.3 | | 20 day SMA | 1266.64 | 1266.24 | 1266.02 | | 35 day SMA | 1258.33 | 1258.27 | 1258.76 | | 50 day SMA | 1264.88 | 1264.89 | 1264.88 | | 100 day SMA | 1254.28 | 1253.88 | 1253.47 | | 150 day SMA | 1247 | 1246.7 | 1246.4 | | 200 day SMA | 1248.95 | 1249.06 | 1249.21 |
|
|
