DjUs DSIB full analysis,charts,indicators,moving averages,SMA,DMA,EMA,ADX,MACD,RSIDj Us DSIB WideScreen charts, DMA,SMA,EMA technical analysis, forecast prediction, by indicators ADX,MACD,RSI,CCI INDICES stock exchange
Daily price and charts and targets DjUs Strong Daily Stock price targets for DjUs DSIB are 711.99 and 720.4 | Daily Target 1 | 709.61 | | Daily Target 2 | 714.36 | | Daily Target 3 | 718.02333333333 | | Daily Target 4 | 722.77 | | Daily Target 5 | 726.43 |
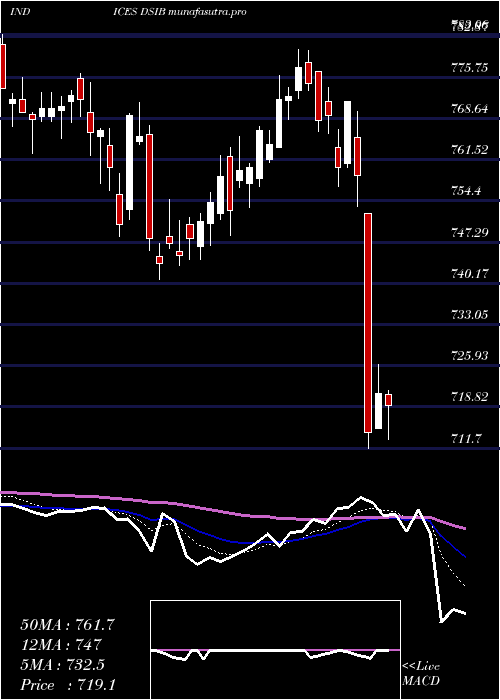
Daily price and volume Dj Us
| Date |
Closing |
Open |
Range |
Volume |
Mon 20 October 2025 |
719.10 (-0.28%) |
721.00 |
713.28 - 721.69 |
0.7704 times |
Fri 17 October 2025 |
721.13 (0.93%) |
715.12 |
715.12 - 726.07 |
1.3462 times |
Thu 16 October 2025 |
714.52 (-5.84%) |
752.16 |
711.70 - 752.24 |
1.9164 times |
Wed 15 October 2025 |
758.82 (-1.64%) |
765.36 |
753.45 - 769.91 |
0.9774 times |
Tue 14 October 2025 |
771.51 (1.49%) |
760.80 |
760.12 - 771.62 |
0.7302 times |
Mon 13 October 2025 |
760.15 (-1.17%) |
763.53 |
757.00 - 766.77 |
0.9048 times |
Fri 10 October 2025 |
769.14 (0.11%) |
771.51 |
766.07 - 773.96 |
0.8842 times |
Thu 09 October 2025 |
768.30 (-0.83%) |
776.78 |
766.38 - 776.78 |
0.9395 times |
Wed 08 October 2025 |
774.74 (-0.33%) |
778.33 |
773.53 - 780.32 |
0.8056 times |
Tue 07 October 2025 |
777.34 (0.64%) |
773.44 |
772.12 - 780.44 |
0.7254 times |
Mon 06 October 2025 |
772.39 (0.07%) |
771.73 |
768.43 - 774.03 |
0.7729 times |
Weekly price and charts DjUs Strong weekly Stock price targets for DjUs DSIB are 711.99 and 720.4 | Weekly Target 1 | 709.61 | | Weekly Target 2 | 714.36 | | Weekly Target 3 | 718.02333333333 | | Weekly Target 4 | 722.77 | | Weekly Target 5 | 726.43 |
Weekly price and volumes for Dj Us
| Date |
Closing |
Open |
Range |
Volume |
Mon 20 October 2025 |
719.10 (-0.28%) |
721.00 |
713.28 - 721.69 |
0.2129 times |
Fri 17 October 2025 |
721.13 (-6.24%) |
763.53 |
711.70 - 771.62 |
1.6235 times |
Fri 10 October 2025 |
769.14 (-0.35%) |
771.73 |
766.07 - 780.44 |
1.1406 times |
Fri 03 October 2025 |
771.84 (1.62%) |
757.34 |
753.22 - 776.00 |
0.9306 times |
Fri 26 September 2025 |
759.55 (1.56%) |
746.45 |
744.32 - 765.54 |
1.2337 times |
Fri 19 September 2025 |
747.89 (-2.3%) |
765.92 |
740.89 - 767.51 |
1.5938 times |
Fri 12 September 2025 |
765.53 (-0.09%) |
765.44 |
748.35 - 771.44 |
1.2074 times |
Fri 05 September 2025 |
766.21 (-0.54%) |
769.99 |
762.29 - 776.46 |
0.8203 times |
Fri 29 August 2025 |
770.39 (0%) |
768.91 |
768.11 - 773.09 |
0.1981 times |
Fri 29 August 2025 |
770.39 (-1.7%) |
781.39 |
762.57 - 783.06 |
1.0391 times |
Fri 22 August 2025 |
783.75 (2.27%) |
765.14 |
764.24 - 791.75 |
0.9859 times |

Monthly price and charts DjUs Strong monthly Stock price targets for DjUs DSIB are 681.03 and 749.77 | Monthly Target 1 | 668.34 | | Monthly Target 2 | 693.72 | | Monthly Target 3 | 737.08 | | Monthly Target 4 | 762.46 | | Monthly Target 5 | 805.82 |
Monthly price and volumes Dj Us
| Date |
Closing |
Open |
Range |
Volume |
Mon 20 October 2025 |
719.10 (-6.19%) |
761.51 |
711.70 - 780.44 |
0.7421 times |
Tue 30 September 2025 |
766.55 (-0.5%) |
769.99 |
740.89 - 776.46 |
1.1479 times |
Fri 29 August 2025 |
770.39 (3.79%) |
739.58 |
729.61 - 791.75 |
1.106 times |
Thu 31 July 2025 |
742.28 (-7%) |
795.30 |
737.10 - 801.24 |
1.2545 times |
Mon 30 June 2025 |
798.18 (-5.58%) |
836.40 |
773.65 - 855.19 |
1.216 times |
Fri 30 May 2025 |
845.32 (4.99%) |
800.38 |
792.10 - 847.24 |
0.9043 times |
Wed 30 April 2025 |
805.11 (-8.8%) |
882.53 |
769.17 - 891.27 |
1.0938 times |
Mon 31 March 2025 |
882.77 (1.22%) |
871.31 |
834.08 - 885.95 |
0.7976 times |
Fri 28 February 2025 |
872.12 (9.85%) |
791.27 |
787.92 - 872.97 |
0.8119 times |
Fri 31 January 2025 |
793.94 (-4.76%) |
758.22 |
747.09 - 805.19 |
0.926 times |
Tue 26 November 2024 |
833.58 (7.62%) |
774.67 |
772.20 - 835.83 |
0.7028 times |

DMA SMA EMA moving averages of Dj Us DSIB
DMA (daily moving average) of Dj Us DSIB
| DMA period | DMA value | | 5 day DMA | 737.02 | | 12 day DMA | 756.58 | | 20 day DMA | 757.29 | | 35 day DMA | 758.31 | | 50 day DMA | 762.42 | | 100 day DMA | 776.43 | | 150 day DMA | 795.14 | | 200 day DMA | 798.91 | EMA (exponential moving average) of Dj Us DSIB
| EMA period | EMA current | EMA prev | EMA prev2 | | 5 day EMA | 732.54 | 739.26 | 748.32 | | 12 day EMA | 747.02 | 752.1 | 757.73 | | 20 day EMA | 752.51 | 756.03 | 759.7 | | 35 day EMA | 757.35 | 759.6 | 761.87 | | 50 day EMA | 758.69 | 760.31 | 761.91 |
SMA (simple moving average) of Dj Us DSIB
| SMA period | SMA current | SMA prev | SMA prev2 | | 5 day SMA | 737.02 | 745.23 | 754.83 | | 12 day SMA | 756.58 | 760.34 | 764.12 | | 20 day SMA | 757.29 | 758.72 | 759.92 | | 35 day SMA | 758.31 | 759.77 | 761.13 | | 50 day SMA | 762.42 | 763.2 | 763.9 | | 100 day SMA | 776.43 | 777.47 | 778.57 | | 150 day SMA | 795.14 | 796.13 | 797.17 | | 200 day SMA | 798.91 | 799.31 | 799.77 |
|
|
