DjUs DSHD full analysis,charts,indicators,moving averages,SMA,DMA,EMA,ADX,MACD,RSIDj Us DSHD WideScreen charts, DMA,SMA,EMA technical analysis, forecast prediction, by indicators ADX,MACD,RSI,CCI INDICES stock exchange
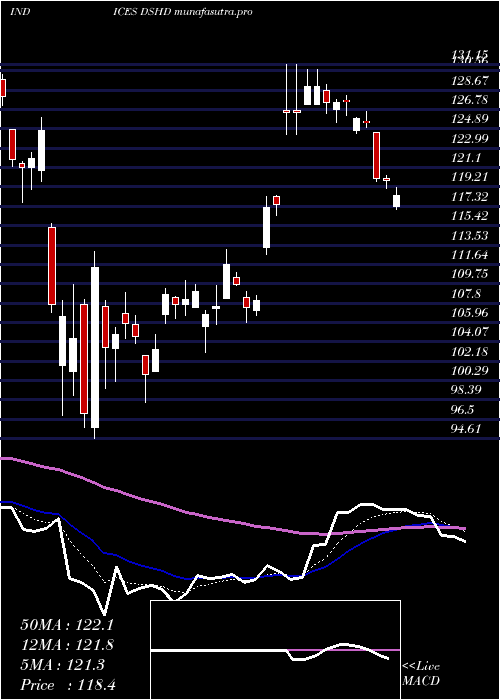
Daily price and charts and targets DjUs Strong Daily Stock price targets for DjUs DSHD are 109.51 and 112.7 | Daily Target 1 | 108.79 | | Daily Target 2 | 110.22 | | Daily Target 3 | 111.98333333333 | | Daily Target 4 | 113.41 | | Daily Target 5 | 115.17 |
Daily price and volume Dj Us
| Date |
Closing |
Open |
Range |
Volume |
Mon 20 October 2025 |
111.64 (-0.79%) |
112.82 |
110.56 - 113.75 |
0.6547 times |
Fri 17 October 2025 |
112.53 (0.29%) |
111.98 |
111.74 - 113.57 |
0.7077 times |
Thu 16 October 2025 |
112.20 (-1.08%) |
114.16 |
111.31 - 114.48 |
1.3085 times |
Wed 15 October 2025 |
113.43 (1.83%) |
111.60 |
111.60 - 114.46 |
1.4298 times |
Tue 14 October 2025 |
111.39 (2.64%) |
107.75 |
107.14 - 111.90 |
1.0324 times |
Mon 13 October 2025 |
108.53 (0.79%) |
108.32 |
108.32 - 110.81 |
0.834 times |
Fri 10 October 2025 |
107.68 (-2.19%) |
112.55 |
107.68 - 112.93 |
1.2978 times |
Thu 09 October 2025 |
110.09 (-2.94%) |
113.95 |
109.66 - 114.10 |
0.9745 times |
Wed 08 October 2025 |
113.42 (0.19%) |
113.72 |
111.77 - 115.02 |
0.7621 times |
Tue 07 October 2025 |
113.21 (-3%) |
116.82 |
112.59 - 116.82 |
0.9985 times |
Mon 06 October 2025 |
116.71 (-2.67%) |
119.58 |
116.00 - 119.58 |
1.0199 times |
Weekly price and charts DjUs Strong weekly Stock price targets for DjUs DSHD are 109.51 and 112.7 | Weekly Target 1 | 108.79 | | Weekly Target 2 | 110.22 | | Weekly Target 3 | 111.98333333333 | | Weekly Target 4 | 113.41 | | Weekly Target 5 | 115.17 |
Weekly price and volumes for Dj Us
| Date |
Closing |
Open |
Range |
Volume |
Mon 20 October 2025 |
111.64 (-0.79%) |
112.82 |
110.56 - 113.75 |
0.0861 times |
Fri 17 October 2025 |
112.53 (4.5%) |
108.32 |
107.14 - 114.48 |
0.6983 times |
Fri 10 October 2025 |
107.68 (-10.2%) |
119.58 |
107.68 - 119.58 |
0.6642 times |
Fri 03 October 2025 |
119.91 (-3.45%) |
126.12 |
118.31 - 126.12 |
0.5041 times |
Fri 26 September 2025 |
124.20 (-7.3%) |
133.98 |
123.69 - 133.98 |
0.5374 times |
Fri 19 September 2025 |
133.98 (-4.08%) |
140.42 |
133.82 - 141.19 |
1.6875 times |
Fri 12 September 2025 |
139.68 (-3.46%) |
145.04 |
139.68 - 145.04 |
1.6221 times |
Fri 05 September 2025 |
144.68 (1.83%) |
139.85 |
138.99 - 149.05 |
2.0358 times |
Fri 29 August 2025 |
142.08 (0%) |
142.48 |
140.63 - 142.78 |
0.3344 times |
Fri 29 August 2025 |
142.08 (0.25%) |
141.28 |
140.37 - 145.14 |
1.83 times |
Fri 22 August 2025 |
141.73 (2%) |
139.07 |
134.75 - 143.11 |
1.9566 times |
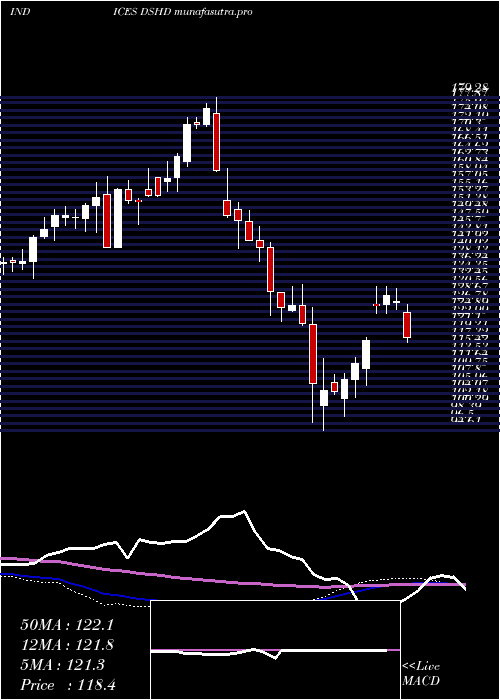
Monthly price and charts DjUs Strong monthly Stock price targets for DjUs DSHD are 101.32 and 117.46 | Monthly Target 1 | 97.88 | | Monthly Target 2 | 104.76 | | Monthly Target 3 | 114.02 | | Monthly Target 4 | 120.9 | | Monthly Target 5 | 130.16 |
Monthly price and volumes Dj Us
| Date |
Closing |
Open |
Range |
Volume |
Mon 20 October 2025 |
111.64 (-9.1%) |
122.81 |
107.14 - 123.28 |
0.2021 times |
Tue 30 September 2025 |
122.81 (-13.56%) |
139.85 |
118.31 - 149.05 |
0.7556 times |
Fri 29 August 2025 |
142.08 (5.11%) |
133.55 |
127.98 - 145.14 |
1.0995 times |
Thu 31 July 2025 |
135.17 (1.38%) |
133.19 |
132.28 - 149.71 |
1.0503 times |
Mon 30 June 2025 |
133.33 (14.29%) |
116.52 |
112.92 - 133.67 |
1.2425 times |
Fri 30 May 2025 |
116.66 (9.29%) |
107.36 |
105.73 - 131.15 |
1.3913 times |
Wed 30 April 2025 |
106.74 (-11.86%) |
121.07 |
94.61 - 125.97 |
1.2735 times |
Mon 31 March 2025 |
121.10 (-14.22%) |
141.26 |
117.65 - 142.43 |
0.8747 times |
Fri 28 February 2025 |
141.18 (-12.1%) |
153.01 |
137.72 - 161.19 |
1.4121 times |
Fri 31 January 2025 |
160.61 (4.06%) |
157.89 |
155.47 - 179.28 |
0.6985 times |
Tue 26 November 2024 |
154.35 (7.66%) |
144.40 |
141.19 - 161.27 |
0.7245 times |

DMA SMA EMA moving averages of Dj Us DSHD
DMA (daily moving average) of Dj Us DSHD
| DMA period | DMA value | | 5 day DMA | 112.24 | | 12 day DMA | 112.56 | | 20 day DMA | 117.62 | | 35 day DMA | 127.49 | | 50 day DMA | 131.21 | | 100 day DMA | 131 | | 150 day DMA | 126.56 | | 200 day DMA | 134.07 | EMA (exponential moving average) of Dj Us DSHD
| EMA period | EMA current | EMA prev | EMA prev2 | | 5 day EMA | 111.99 | 112.17 | 111.99 | | 12 day EMA | 114.14 | 114.6 | 114.98 | | 20 day EMA | 117.87 | 118.52 | 119.15 | | 35 day EMA | 123.15 | 123.83 | 124.5 | | 50 day EMA | 129.38 | 130.1 | 130.82 |
SMA (simple moving average) of Dj Us DSHD
| SMA period | SMA current | SMA prev | SMA prev2 | | 5 day SMA | 112.24 | 111.62 | 110.65 | | 12 day SMA | 112.56 | 113.34 | 114.2 | | 20 day SMA | 117.62 | 118.74 | 119.98 | | 35 day SMA | 127.49 | 128.36 | 129.22 | | 50 day SMA | 131.21 | 131.63 | 132.03 | | 100 day SMA | 131 | 131.09 | 131.22 | | 150 day SMA | 126.56 | 126.68 | 126.83 | | 200 day SMA | 134.07 | 134.29 | 134.51 |
|
|
