DjUs DSGT full analysis,charts,indicators,moving averages,SMA,DMA,EMA,ADX,MACD,RSIDj Us DSGT WideScreen charts, DMA,SMA,EMA technical analysis, forecast prediction, by indicators ADX,MACD,RSI,CCI INDICES stock exchange
Daily price and charts and targets DjUs Strong Daily Stock price targets for DjUs DSGT are 3438.76 and 3461.29 | Daily Target 1 | 3420.38 | | Daily Target 2 | 3434.61 | | Daily Target 3 | 3442.9133333333 | | Daily Target 4 | 3457.14 | | Daily Target 5 | 3465.44 |
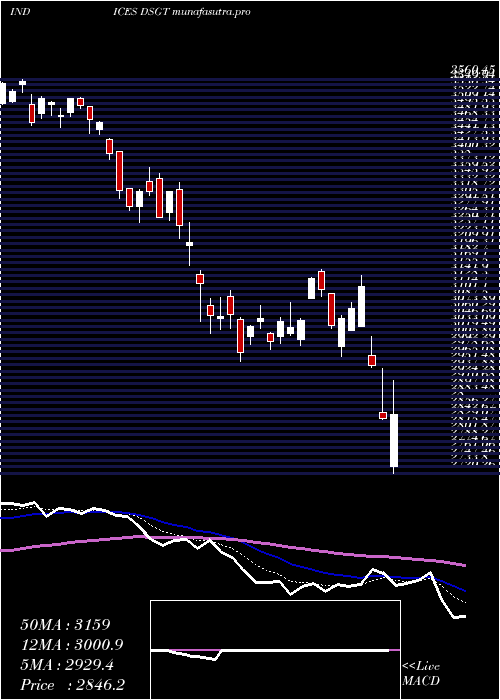
Daily price and volume Dj Us
| Date |
Closing |
Open |
Range |
Volume |
Mon 20 October 2025 |
3448.83 (0.9%) |
3429.39 |
3428.69 - 3451.22 |
0.8096 times |
Fri 17 October 2025 |
3418.17 (0.24%) |
3413.80 |
3396.11 - 3425.47 |
0.9332 times |
Thu 16 October 2025 |
3409.87 (-1.09%) |
3456.36 |
3389.42 - 3465.44 |
0.9187 times |
Wed 15 October 2025 |
3447.37 (0.06%) |
3451.59 |
3424.87 - 3474.49 |
1.0139 times |
Tue 14 October 2025 |
3445.16 (0.22%) |
3399.10 |
3387.92 - 3462.50 |
1.0474 times |
Mon 13 October 2025 |
3437.75 (1.26%) |
3406.09 |
3406.09 - 3442.97 |
0.9717 times |
Fri 10 October 2025 |
3394.88 (-2.67%) |
3488.39 |
3394.81 - 3498.68 |
1.3115 times |
Thu 09 October 2025 |
3487.93 (0.42%) |
3472.00 |
3452.80 - 3490.40 |
1.058 times |
Wed 08 October 2025 |
3473.18 (0.74%) |
3458.48 |
3438.31 - 3483.64 |
1.0048 times |
Tue 07 October 2025 |
3447.71 (0.23%) |
3441.88 |
3426.20 - 3449.76 |
0.9313 times |
Mon 06 October 2025 |
3439.67 (0.08%) |
3439.52 |
3404.85 - 3444.92 |
1.0473 times |
Weekly price and charts DjUs Strong weekly Stock price targets for DjUs DSGT are 3438.76 and 3461.29 | Weekly Target 1 | 3420.38 | | Weekly Target 2 | 3434.61 | | Weekly Target 3 | 3442.9133333333 | | Weekly Target 4 | 3457.14 | | Weekly Target 5 | 3465.44 |
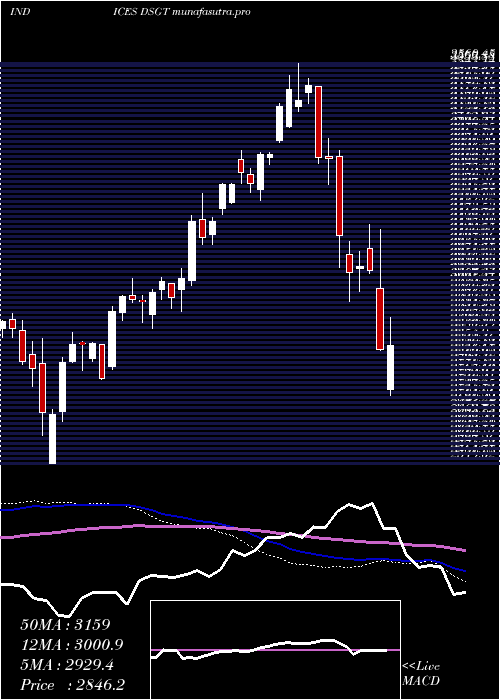
Weekly price and volumes for Dj Us
| Date |
Closing |
Open |
Range |
Volume |
Mon 20 October 2025 |
3448.83 (0.9%) |
3429.39 |
3428.69 - 3451.22 |
0.1883 times |
Fri 17 October 2025 |
3418.17 (0.69%) |
3406.09 |
3387.92 - 3474.49 |
1.136 times |
Fri 10 October 2025 |
3394.88 (-1.23%) |
3439.52 |
3394.81 - 3498.68 |
1.2448 times |
Fri 03 October 2025 |
3437.03 (-1.08%) |
3475.31 |
3435.63 - 3490.65 |
1.0445 times |
Fri 26 September 2025 |
3474.52 (-2.7%) |
3559.44 |
3450.41 - 3559.44 |
1.2591 times |
Fri 19 September 2025 |
3571.00 (0.32%) |
3577.20 |
3563.89 - 3605.28 |
1.4129 times |
Fri 12 September 2025 |
3559.57 (-0.95%) |
3611.79 |
3545.22 - 3649.51 |
1.2848 times |
Fri 05 September 2025 |
3593.67 (2%) |
3481.18 |
3471.19 - 3621.49 |
1.0276 times |
Fri 29 August 2025 |
3523.18 (0%) |
3550.81 |
3512.56 - 3551.33 |
0.2285 times |
Fri 29 August 2025 |
3523.18 (-0.47%) |
3528.67 |
3501.25 - 3558.47 |
1.1736 times |
Fri 22 August 2025 |
3539.90 (-0.47%) |
3552.06 |
3463.99 - 3572.83 |
1.2117 times |
Monthly price and charts DjUs Strong monthly Stock price targets for DjUs DSGT are 3418.38 and 3529.14 | Monthly Target 1 | 3334.38 | | Monthly Target 2 | 3391.61 | | Monthly Target 3 | 3445.1433333333 | | Monthly Target 4 | 3502.37 | | Monthly Target 5 | 3555.9 |
Monthly price and volumes Dj Us
| Date |
Closing |
Open |
Range |
Volume |
Mon 20 October 2025 |
3448.83 (-0.62%) |
3441.51 |
3387.92 - 3498.68 |
0.6319 times |
Tue 30 September 2025 |
3470.39 (-1.5%) |
3481.18 |
3450.41 - 3649.51 |
1.1446 times |
Fri 29 August 2025 |
3523.18 (1.33%) |
3352.54 |
3338.70 - 3580.23 |
1.0302 times |
Thu 31 July 2025 |
3476.83 (1.41%) |
3426.08 |
3384.48 - 3507.62 |
0.9468 times |
Mon 30 June 2025 |
3428.42 (3.42%) |
3305.78 |
3282.00 - 3453.49 |
1.1123 times |
Fri 30 May 2025 |
3315.04 (6.32%) |
3151.66 |
3124.96 - 3373.23 |
1.296 times |
Wed 30 April 2025 |
3118.08 (2.25%) |
3024.31 |
2720.26 - 3142.20 |
1.2144 times |
Mon 31 March 2025 |
3049.40 (-8.18%) |
3326.27 |
2958.89 - 3340.77 |
1.0384 times |
Fri 28 February 2025 |
3320.94 (-5.01%) |
3452.77 |
3255.31 - 3560.45 |
0.8321 times |
Fri 31 January 2025 |
3496.15 (7.43%) |
3318.98 |
3213.35 - 3530.07 |
0.7533 times |
Tue 26 November 2024 |
3254.47 (10.65%) |
3029.19 |
3000.26 - 3258.57 |
0.9544 times |
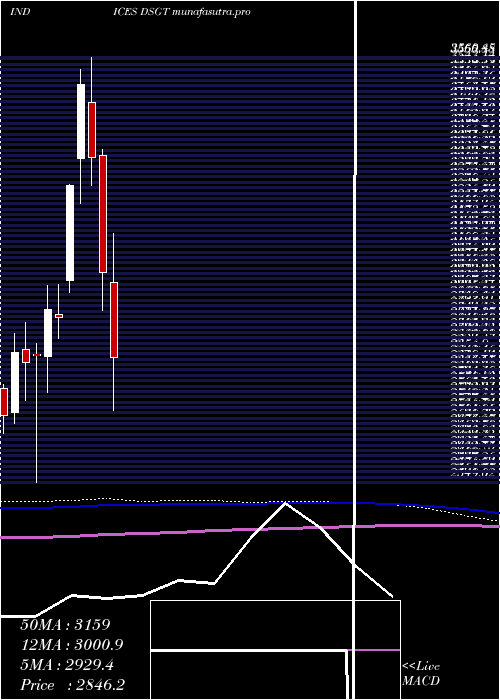
DMA SMA EMA moving averages of Dj Us DSGT
DMA (daily moving average) of Dj Us DSGT
| DMA period | DMA value | | 5 day DMA | 3433.88 | | 12 day DMA | 3440.63 | | 20 day DMA | 3457.12 | | 35 day DMA | 3508.21 | | 50 day DMA | 3514.62 | | 100 day DMA | 3454.29 | | 150 day DMA | 3338.46 | | 200 day DMA | 3342.27 | EMA (exponential moving average) of Dj Us DSGT
| EMA period | EMA current | EMA prev | EMA prev2 | | 5 day EMA | 3434.96 | 3428.03 | 3432.96 | | 12 day EMA | 3445.78 | 3445.23 | 3450.15 | | 20 day EMA | 3461.85 | 3463.22 | 3467.96 | | 35 day EMA | 3477.61 | 3479.3 | 3482.9 | | 50 day EMA | 3500.04 | 3502.13 | 3505.56 |
SMA (simple moving average) of Dj Us DSGT
| SMA period | SMA current | SMA prev | SMA prev2 | | 5 day SMA | 3433.88 | 3431.66 | 3427.01 | | 12 day SMA | 3440.63 | 3441.11 | 3445.46 | | 20 day SMA | 3457.12 | 3463.22 | 3470.93 | | 35 day SMA | 3508.21 | 3510.33 | 3514.16 | | 50 day SMA | 3514.62 | 3515.41 | 3516.65 | | 100 day SMA | 3454.29 | 3452.66 | 3451.8 | | 150 day SMA | 3338.46 | 3336.89 | 3335.77 | | 200 day SMA | 3342.27 | 3340.99 | 3340 |
|
|
