DjUs DSGI full analysis,charts,indicators,moving averages,SMA,DMA,EMA,ADX,MACD,RSIDj Us DSGI WideScreen charts, DMA,SMA,EMA technical analysis, forecast prediction, by indicators ADX,MACD,RSI,CCI INDICES stock exchange
Daily price and charts and targets DjUs Strong Daily Stock price targets for DjUs DSGI are 693.81 and 701.55 | Daily Target 1 | 687.54 | | Daily Target 2 | 692.33 | | Daily Target 3 | 695.28333333333 | | Daily Target 4 | 700.07 | | Daily Target 5 | 703.02 |
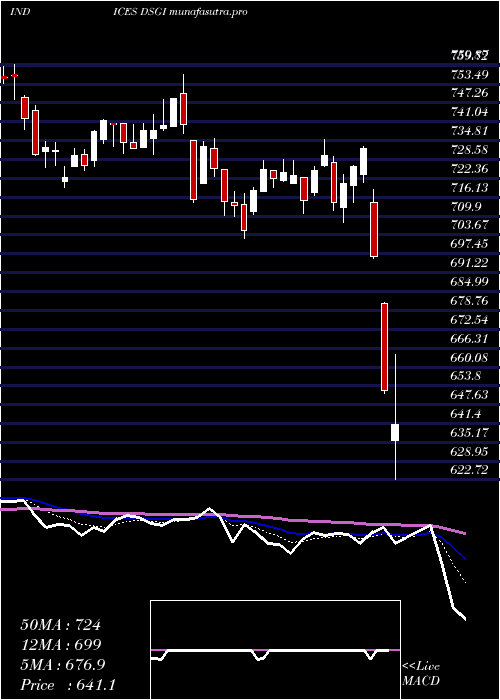
Daily price and volume Dj Us
| Date |
Closing |
Open |
Range |
Volume |
Mon 20 October 2025 |
697.11 (1.38%) |
691.22 |
690.50 - 698.24 |
0.8068 times |
Fri 17 October 2025 |
687.60 (0.18%) |
686.68 |
684.56 - 691.67 |
0.9876 times |
Thu 16 October 2025 |
686.35 (-0.23%) |
688.49 |
684.52 - 691.38 |
1.2521 times |
Wed 15 October 2025 |
687.94 (-1.1%) |
697.39 |
684.99 - 700.02 |
0.8394 times |
Tue 14 October 2025 |
695.58 (1.83%) |
681.96 |
677.57 - 697.23 |
1.0651 times |
Mon 13 October 2025 |
683.07 (0.85%) |
681.73 |
680.35 - 686.11 |
1.0375 times |
Fri 10 October 2025 |
677.30 (-1.96%) |
692.95 |
677.00 - 695.86 |
1.2713 times |
Thu 09 October 2025 |
690.87 (-1.91%) |
704.73 |
687.71 - 705.48 |
1.069 times |
Wed 08 October 2025 |
704.35 (0.74%) |
699.92 |
697.61 - 704.81 |
0.782 times |
Tue 07 October 2025 |
699.19 (-0.33%) |
702.62 |
696.25 - 706.33 |
0.8893 times |
Mon 06 October 2025 |
701.48 (-1.14%) |
706.56 |
699.44 - 707.84 |
0.9439 times |
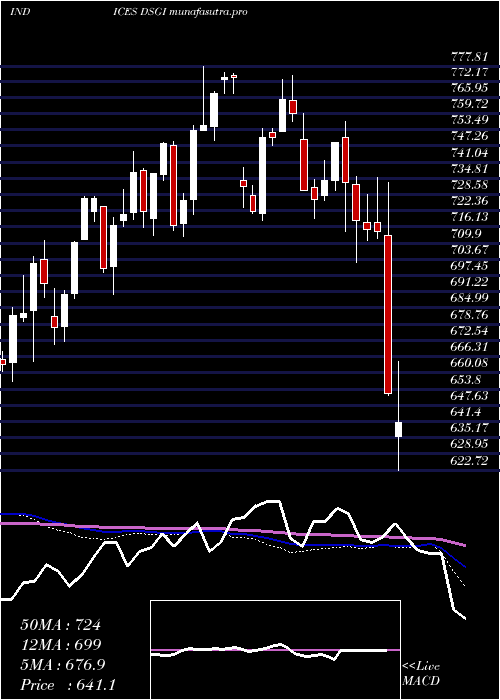
Weekly price and charts DjUs Strong weekly Stock price targets for DjUs DSGI are 693.81 and 701.55 | Weekly Target 1 | 687.54 | | Weekly Target 2 | 692.33 | | Weekly Target 3 | 695.28333333333 | | Weekly Target 4 | 700.07 | | Weekly Target 5 | 703.02 |
Weekly price and volumes for Dj Us
| Date |
Closing |
Open |
Range |
Volume |
Mon 20 October 2025 |
697.11 (1.38%) |
691.22 |
690.50 - 698.24 |
0.1979 times |
Fri 17 October 2025 |
687.60 (1.52%) |
681.73 |
677.57 - 700.02 |
1.2713 times |
Fri 10 October 2025 |
677.30 (-4.55%) |
706.56 |
677.00 - 707.84 |
1.2158 times |
Fri 03 October 2025 |
709.60 (1.5%) |
702.37 |
698.94 - 715.21 |
0.8901 times |
Fri 26 September 2025 |
699.13 (-1.22%) |
707.07 |
694.83 - 711.85 |
1.3344 times |
Fri 19 September 2025 |
707.80 (-1.08%) |
718.13 |
704.27 - 722.96 |
1.6149 times |
Fri 12 September 2025 |
715.55 (-1%) |
723.77 |
708.76 - 726.33 |
1.1383 times |
Fri 05 September 2025 |
722.77 (-1.73%) |
725.14 |
711.90 - 728.22 |
1.0209 times |
Fri 29 August 2025 |
735.48 (0%) |
736.72 |
734.85 - 741.04 |
0.2056 times |
Fri 29 August 2025 |
735.48 (-0.99%) |
739.59 |
731.33 - 741.04 |
1.1108 times |
Fri 22 August 2025 |
742.82 (3.39%) |
718.42 |
715.51 - 745.42 |
1.3816 times |
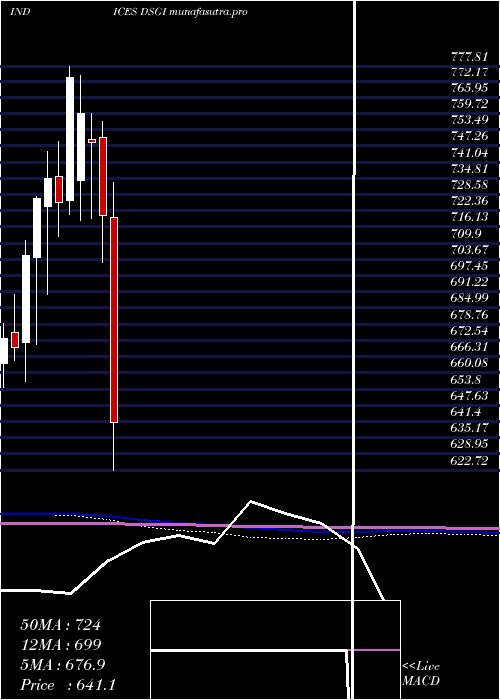
Monthly price and charts DjUs Strong monthly Stock price targets for DjUs DSGI are 667.95 and 706.16 | Monthly Target 1 | 658.23 | | Monthly Target 2 | 677.67 | | Monthly Target 3 | 696.44 | | Monthly Target 4 | 715.88 | | Monthly Target 5 | 734.65 |
Monthly price and volumes Dj Us
| Date |
Closing |
Open |
Range |
Volume |
Mon 20 October 2025 |
697.11 (-1.53%) |
707.96 |
677.00 - 715.21 |
0.5438 times |
Tue 30 September 2025 |
707.93 (-3.75%) |
725.14 |
694.83 - 728.22 |
0.9805 times |
Fri 29 August 2025 |
735.48 (0.96%) |
726.73 |
710.61 - 745.42 |
1.0163 times |
Thu 31 July 2025 |
728.48 (-2.06%) |
747.48 |
727.35 - 783.86 |
0.8817 times |
Mon 30 June 2025 |
743.83 (1.43%) |
730.23 |
714.46 - 744.78 |
0.9065 times |
Fri 30 May 2025 |
733.34 (5.53%) |
690.18 |
686.93 - 747.46 |
1.2602 times |
Wed 30 April 2025 |
694.91 (-3.56%) |
719.97 |
613.95 - 733.02 |
1.5124 times |
Mon 31 March 2025 |
720.58 (-3.74%) |
750.44 |
702.62 - 756.58 |
0.9578 times |
Fri 28 February 2025 |
748.57 (-1.45%) |
749.71 |
719.38 - 759.87 |
1.0973 times |
Fri 31 January 2025 |
759.57 (-1.8%) |
733.86 |
718.48 - 774.20 |
0.8435 times |
Tue 26 November 2024 |
773.46 (6.63%) |
726.38 |
721.10 - 777.81 |
0.7591 times |
DMA SMA EMA moving averages of Dj Us DSGI
DMA (daily moving average) of Dj Us DSGI
| DMA period | DMA value | | 5 day DMA | 690.92 | | 12 day DMA | 693.37 | | 20 day DMA | 697.3 | | 35 day DMA | 705.92 | | 50 day DMA | 713.22 | | 100 day DMA | 727.61 | | 150 day DMA | 719.89 | | 200 day DMA | 726.64 | EMA (exponential moving average) of Dj Us DSGI
| EMA period | EMA current | EMA prev | EMA prev2 | | 5 day EMA | 691.33 | 688.44 | 688.86 | | 12 day EMA | 693.46 | 692.8 | 693.75 | | 20 day EMA | 697.38 | 697.41 | 698.44 | | 35 day EMA | 704.34 | 704.77 | 705.78 | | 50 day EMA | 711.62 | 712.21 | 713.21 |
SMA (simple moving average) of Dj Us DSGI
| SMA period | SMA current | SMA prev | SMA prev2 | | 5 day SMA | 690.92 | 688.11 | 686.05 | | 12 day SMA | 693.37 | 694.28 | 695.98 | | 20 day SMA | 697.3 | 697.84 | 698.97 | | 35 day SMA | 705.92 | 707.01 | 708.43 | | 50 day SMA | 713.22 | 713.77 | 714.49 | | 100 day SMA | 727.61 | 727.95 | 728.53 | | 150 day SMA | 719.89 | 720.01 | 720.36 | | 200 day SMA | 726.64 | 726.96 | 727.35 |
|
|
