DjUs DSGF full analysis,charts,indicators,moving averages,SMA,DMA,EMA,ADX,MACD,RSIDj Us DSGF WideScreen charts, DMA,SMA,EMA technical analysis, forecast prediction, by indicators ADX,MACD,RSI,CCI INDICES stock exchange
Daily price and charts and targets DjUs Strong Daily Stock price targets for DjUs DSGF are 2736.49 and 2766.01 | Daily Target 1 | 2712.89 | | Daily Target 2 | 2730.57 | | Daily Target 3 | 2742.41 | | Daily Target 4 | 2760.09 | | Daily Target 5 | 2771.93 |
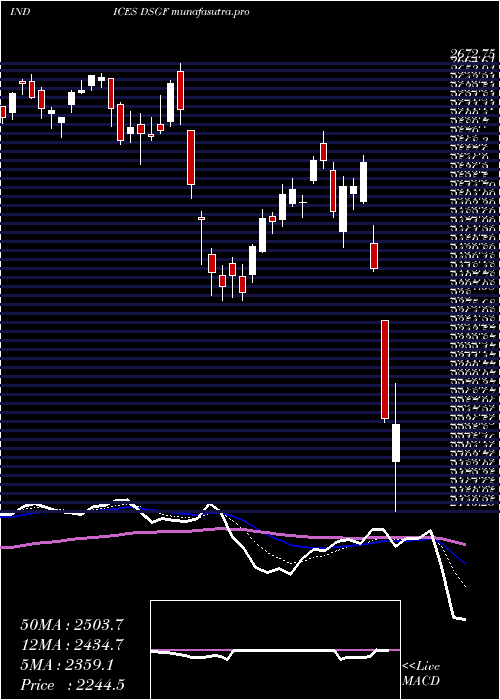
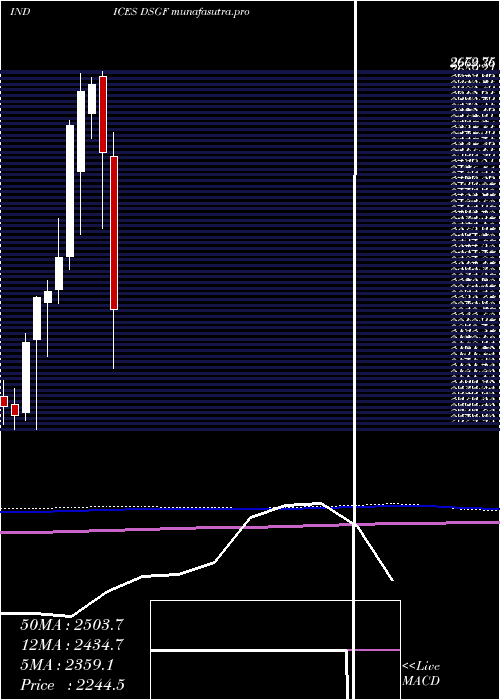
Daily price and volume Dj Us
| Date |
Closing |
Open |
Range |
Volume |
Mon 20 October 2025 |
2748.25 (1.17%) |
2727.16 |
2724.73 - 2754.25 |
0.9538 times |
Fri 17 October 2025 |
2716.41 (1%) |
2698.72 |
2691.14 - 2724.77 |
0.9652 times |
Thu 16 October 2025 |
2689.50 (-2.43%) |
2757.51 |
2680.11 - 2759.59 |
1.102 times |
Wed 15 October 2025 |
2756.48 (-0.01%) |
2769.50 |
2735.33 - 2781.80 |
0.9159 times |
Tue 14 October 2025 |
2756.83 (1.03%) |
2706.78 |
2706.78 - 2776.19 |
1.0296 times |
Mon 13 October 2025 |
2728.68 (1.04%) |
2721.93 |
2707.42 - 2734.90 |
0.8398 times |
Fri 10 October 2025 |
2700.69 (-2.33%) |
2775.63 |
2700.60 - 2782.50 |
1.2051 times |
Thu 09 October 2025 |
2765.24 (-0.4%) |
2782.13 |
2755.61 - 2787.36 |
0.8963 times |
Wed 08 October 2025 |
2776.44 (-0.28%) |
2792.19 |
2762.81 - 2794.13 |
0.9425 times |
Tue 07 October 2025 |
2784.24 (0.03%) |
2791.05 |
2770.70 - 2801.25 |
1.1497 times |
Mon 06 October 2025 |
2783.51 (-0.05%) |
2795.18 |
2762.66 - 2797.42 |
1.0706 times |
Weekly price and charts DjUs Strong weekly Stock price targets for DjUs DSGF are 2736.49 and 2766.01 | Weekly Target 1 | 2712.89 | | Weekly Target 2 | 2730.57 | | Weekly Target 3 | 2742.41 | | Weekly Target 4 | 2760.09 | | Weekly Target 5 | 2771.93 |
Weekly price and volumes for Dj Us
| Date |
Closing |
Open |
Range |
Volume |
Mon 20 October 2025 |
2748.25 (1.17%) |
2727.16 |
2724.73 - 2754.25 |
0.2514 times |
Fri 17 October 2025 |
2716.41 (0.58%) |
2721.93 |
2680.11 - 2781.80 |
1.2792 times |
Fri 10 October 2025 |
2700.69 (-3.02%) |
2795.18 |
2700.60 - 2801.25 |
1.3877 times |
Fri 03 October 2025 |
2784.89 (0.18%) |
2788.99 |
2762.06 - 2807.18 |
1.2812 times |
Fri 26 September 2025 |
2779.83 (-1.18%) |
2795.56 |
2752.00 - 2838.41 |
1.0345 times |
Fri 19 September 2025 |
2812.99 (0.79%) |
2799.71 |
2769.80 - 2837.37 |
1.4511 times |
Fri 12 September 2025 |
2790.93 (1.26%) |
2759.73 |
2753.12 - 2815.83 |
1.161 times |
Fri 05 September 2025 |
2756.07 (-1.74%) |
2780.33 |
2740.56 - 2813.68 |
0.8875 times |
Fri 29 August 2025 |
2805.00 (0%) |
2804.23 |
2792.62 - 2811.53 |
0.1747 times |
Fri 29 August 2025 |
2805.00 (0.53%) |
2785.89 |
2769.24 - 2811.53 |
1.0917 times |
Fri 22 August 2025 |
2790.27 (1.51%) |
2743.79 |
2723.97 - 2797.58 |
1.0867 times |

Monthly price and charts DjUs Strong monthly Stock price targets for DjUs DSGF are 2653.61 and 2774.75 | Monthly Target 1 | 2622.06 | | Monthly Target 2 | 2685.16 | | Monthly Target 3 | 2743.2033333333 | | Monthly Target 4 | 2806.3 | | Monthly Target 5 | 2864.34 |
Monthly price and volumes Dj Us
| Date |
Closing |
Open |
Range |
Volume |
Mon 20 October 2025 |
2748.25 (-1.29%) |
2776.19 |
2680.11 - 2801.25 |
0.8198 times |
Tue 30 September 2025 |
2784.13 (-0.74%) |
2780.33 |
2740.56 - 2838.41 |
1.1439 times |
Fri 29 August 2025 |
2805.00 (2.39%) |
2704.12 |
2671.44 - 2811.53 |
1.0488 times |
Thu 31 July 2025 |
2739.60 (1.35%) |
2694.20 |
2671.35 - 2786.51 |
1.1353 times |
Mon 30 June 2025 |
2703.18 (3%) |
2613.37 |
2553.03 - 2705.50 |
1.0054 times |
Fri 30 May 2025 |
2624.35 (4.39%) |
2517.06 |
2500.50 - 2673.10 |
1.1593 times |
Wed 30 April 2025 |
2514.04 (-0.49%) |
2518.73 |
2140.25 - 2563.40 |
1.1552 times |
Mon 31 March 2025 |
2526.48 (-4.64%) |
2663.02 |
2390.96 - 2672.75 |
0.9388 times |
Fri 28 February 2025 |
2649.44 (0.5%) |
2597.13 |
2552.46 - 2660.65 |
0.8097 times |
Fri 31 January 2025 |
2636.33 (2.4%) |
2492.30 |
2379.99 - 2668.10 |
0.7839 times |
Tue 26 November 2024 |
2574.44 (10.06%) |
2340.03 |
2316.59 - 2584.44 |
0.834 times |
DMA SMA EMA moving averages of Dj Us DSGF
DMA (daily moving average) of Dj Us DSGF
| DMA period | DMA value | | 5 day DMA | 2733.49 | | 12 day DMA | 2749.26 | | 20 day DMA | 2763.2 | | 35 day DMA | 2774.4 | | 50 day DMA | 2772.11 | | 100 day DMA | 2724.02 | | 150 day DMA | 2648.28 | | 200 day DMA | 2628.9 | EMA (exponential moving average) of Dj Us DSGF
| EMA period | EMA current | EMA prev | EMA prev2 | | 5 day EMA | 2733.19 | 2725.66 | 2730.28 | | 12 day EMA | 2745.08 | 2744.5 | 2749.6 | | 20 day EMA | 2754.68 | 2755.36 | 2759.46 | | 35 day EMA | 2759.39 | 2760.05 | 2762.62 | | 50 day EMA | 2762.79 | 2763.38 | 2765.3 |
SMA (simple moving average) of Dj Us DSGF
| SMA period | SMA current | SMA prev | SMA prev2 | | 5 day SMA | 2733.49 | 2729.58 | 2726.44 | | 12 day SMA | 2749.26 | 2750.42 | 2756.06 | | 20 day SMA | 2763.2 | 2766.44 | 2770.9 | | 35 day SMA | 2774.4 | 2776.02 | 2778.43 | | 50 day SMA | 2772.11 | 2771.51 | 2771.01 | | 100 day SMA | 2724.02 | 2722.49 | 2721.82 | | 150 day SMA | 2648.28 | 2646.82 | 2646.17 | | 200 day SMA | 2628.9 | 2627.68 | 2626.63 |
|
|
