DjUs DSFO full analysis,charts,indicators,moving averages,SMA,DMA,EMA,ADX,MACD,RSIDj Us DSFO WideScreen charts, DMA,SMA,EMA technical analysis, forecast prediction, by indicators ADX,MACD,RSI,CCI INDICES stock exchange
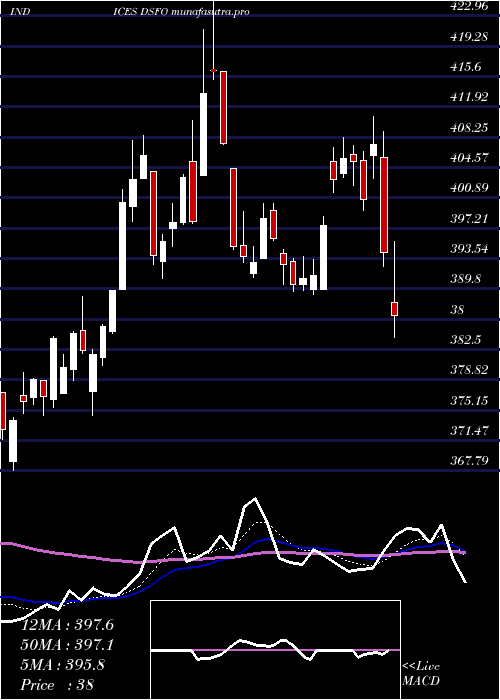
Daily price and charts and targets DjUs Strong Daily Stock price targets for DjUs DSFO are 380.15 and 382.06 | Daily Target 1 | 378.7 | | Daily Target 2 | 379.69 | | Daily Target 3 | 380.61333333333 | | Daily Target 4 | 381.6 | | Daily Target 5 | 382.52 |
Daily price and volume Dj Us
| Date |
Closing |
Open |
Range |
Volume |
Mon 20 October 2025 |
380.67 (0.22%) |
380.47 |
379.63 - 381.54 |
0.7488 times |
Fri 17 October 2025 |
379.84 (1.1%) |
376.59 |
374.96 - 380.02 |
0.9707 times |
Thu 16 October 2025 |
375.70 (-0.12%) |
376.81 |
374.88 - 380.63 |
1.0831 times |
Wed 15 October 2025 |
376.14 (0.25%) |
375.04 |
373.99 - 379.25 |
1.0426 times |
Tue 14 October 2025 |
375.19 (1.07%) |
370.33 |
368.34 - 375.56 |
1.1066 times |
Mon 13 October 2025 |
371.21 (-0.7%) |
371.90 |
369.21 - 373.18 |
0.9669 times |
Fri 10 October 2025 |
373.83 (0.2%) |
373.91 |
373.14 - 376.25 |
1.0501 times |
Thu 09 October 2025 |
373.08 (-0.91%) |
377.03 |
372.39 - 377.07 |
0.8518 times |
Wed 08 October 2025 |
376.51 (-1.02%) |
379.58 |
374.93 - 379.58 |
0.9703 times |
Tue 07 October 2025 |
380.38 (0.36%) |
378.89 |
377.45 - 382.23 |
1.209 times |
Mon 06 October 2025 |
379.00 (-0.73%) |
380.76 |
378.26 - 381.56 |
1.0723 times |
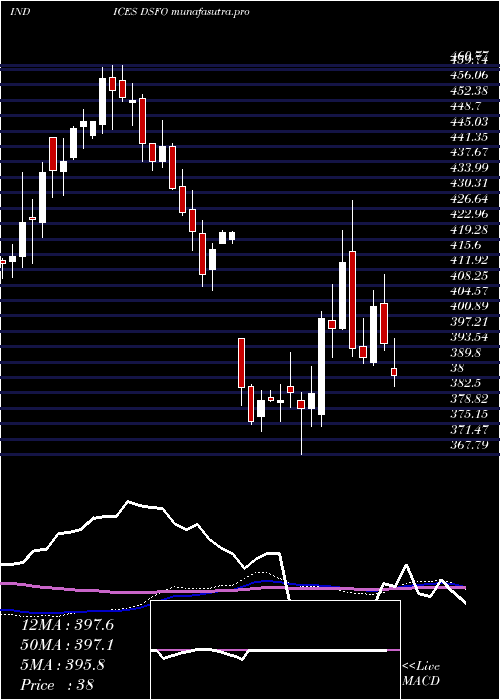
Weekly price and charts DjUs Strong weekly Stock price targets for DjUs DSFO are 380.15 and 382.06 | Weekly Target 1 | 378.7 | | Weekly Target 2 | 379.69 | | Weekly Target 3 | 380.61333333333 | | Weekly Target 4 | 381.6 | | Weekly Target 5 | 382.52 |
Weekly price and volumes for Dj Us
| Date |
Closing |
Open |
Range |
Volume |
Mon 20 October 2025 |
380.67 (0.22%) |
380.47 |
379.63 - 381.54 |
0.1645 times |
Fri 17 October 2025 |
379.84 (1.61%) |
371.90 |
368.34 - 380.63 |
1.1361 times |
Fri 10 October 2025 |
373.83 (-2.08%) |
380.76 |
372.39 - 382.23 |
1.1325 times |
Fri 03 October 2025 |
381.78 (1.36%) |
377.91 |
371.94 - 383.38 |
1.0517 times |
Fri 26 September 2025 |
376.64 (-0.47%) |
377.54 |
372.43 - 382.21 |
1.1189 times |
Fri 19 September 2025 |
378.42 (0.13%) |
378.10 |
372.46 - 382.50 |
1.6069 times |
Fri 12 September 2025 |
377.92 (-1.48%) |
382.27 |
374.54 - 383.99 |
1.032 times |
Fri 05 September 2025 |
383.60 (0.37%) |
382.38 |
373.47 - 385.61 |
1.0869 times |
Fri 29 August 2025 |
382.20 (0%) |
378.68 |
378.68 - 382.51 |
0.2518 times |
Fri 29 August 2025 |
382.20 (-1.95%) |
388.56 |
376.13 - 388.56 |
1.4187 times |
Fri 22 August 2025 |
389.82 (2.62%) |
379.79 |
377.07 - 390.30 |
1.0087 times |
Monthly price and charts DjUs Strong monthly Stock price targets for DjUs DSFO are 374.51 and 389.55 | Monthly Target 1 | 362.42 | | Monthly Target 2 | 371.55 | | Monthly Target 3 | 377.46333333333 | | Monthly Target 4 | 386.59 | | Monthly Target 5 | 392.5 |
Monthly price and volumes Dj Us
| Date |
Closing |
Open |
Range |
Volume |
Mon 20 October 2025 |
380.67 (1.05%) |
377.62 |
368.34 - 383.38 |
0.669 times |
Tue 30 September 2025 |
376.70 (-1.44%) |
382.38 |
371.94 - 385.61 |
1.271 times |
Fri 29 August 2025 |
382.20 (0.7%) |
380.37 |
373.82 - 390.30 |
1.1083 times |
Thu 31 July 2025 |
379.54 (-0.99%) |
383.23 |
375.74 - 398.75 |
1.1907 times |
Mon 30 June 2025 |
383.33 (-0.79%) |
385.79 |
379.80 - 391.94 |
1.0292 times |
Fri 30 May 2025 |
386.40 (-2.6%) |
392.38 |
374.58 - 395.22 |
1.0914 times |
Wed 30 April 2025 |
396.70 (-2.2%) |
406.18 |
372.51 - 410.80 |
0.8776 times |
Mon 31 March 2025 |
405.61 (1.96%) |
397.85 |
389.14 - 428.42 |
0.9548 times |
Fri 28 February 2025 |
397.83 (3.94%) |
380.77 |
367.79 - 408.43 |
0.9409 times |
Fri 31 January 2025 |
382.75 (-9.06%) |
395.51 |
373.39 - 395.51 |
0.8671 times |
Tue 26 November 2024 |
420.87 (-1.04%) |
426.35 |
406.94 - 430.90 |
0.7731 times |

DMA SMA EMA moving averages of Dj Us DSFO
DMA (daily moving average) of Dj Us DSFO
| DMA period | DMA value | | 5 day DMA | 377.51 | | 12 day DMA | 376.94 | | 20 day DMA | 376.88 | | 35 day DMA | 377.95 | | 50 day DMA | 379.09 | | 100 day DMA | 382.08 | | 150 day DMA | 385.89 | | 200 day DMA | 386.96 | EMA (exponential moving average) of Dj Us DSFO
| EMA period | EMA current | EMA prev | EMA prev2 | | 5 day EMA | 378.09 | 376.8 | 375.28 | | 12 day EMA | 377.15 | 376.51 | 375.9 | | 20 day EMA | 377.26 | 376.9 | 376.59 | | 35 day EMA | 377.99 | 377.83 | 377.71 | | 50 day EMA | 378.94 | 378.87 | 378.83 |
SMA (simple moving average) of Dj Us DSFO
| SMA period | SMA current | SMA prev | SMA prev2 | | 5 day SMA | 377.51 | 375.62 | 374.41 | | 12 day SMA | 376.94 | 376.92 | 376.65 | | 20 day SMA | 376.88 | 376.76 | 376.65 | | 35 day SMA | 377.95 | 377.99 | 377.96 | | 50 day SMA | 379.09 | 379.08 | 379.1 | | 100 day SMA | 382.08 | 382.07 | 382.15 | | 150 day SMA | 385.89 | 386.01 | 386.16 | | 200 day SMA | 386.96 | 387.14 | 387.34 |
|
|
