DjUs DSFE full analysis,charts,indicators,moving averages,SMA,DMA,EMA,ADX,MACD,RSIDj Us DSFE WideScreen charts, DMA,SMA,EMA technical analysis, forecast prediction, by indicators ADX,MACD,RSI,CCI INDICES stock exchange
Daily price and charts and targets DjUs Strong Daily Stock price targets for DjUs DSFE are 1308.07 and 1320.73 | Daily Target 1 | 1298.28 | | Daily Target 2 | 1305.2 | | Daily Target 3 | 1310.94 | | Daily Target 4 | 1317.86 | | Daily Target 5 | 1323.6 |
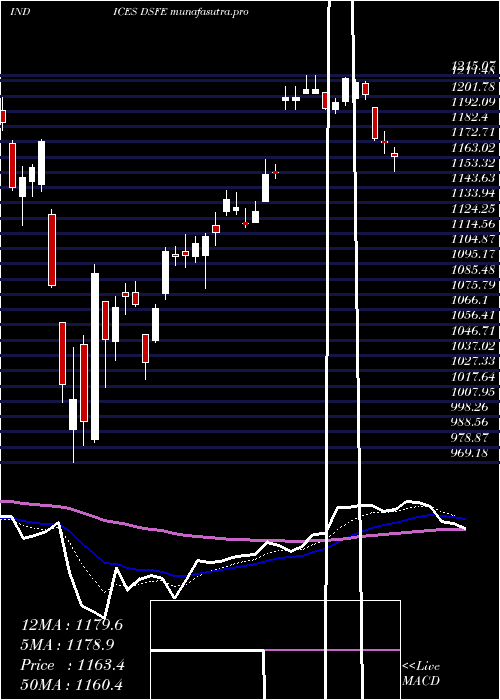
Daily price and volume Dj Us
| Date |
Closing |
Open |
Range |
Volume |
Thu 04 December 2025 |
1312.12 (0.36%) |
1305.98 |
1304.02 - 1316.68 |
1.1063 times |
Wed 03 December 2025 |
1307.42 (0.92%) |
1299.05 |
1298.69 - 1308.84 |
0.9141 times |
Tue 02 December 2025 |
1295.44 (0%) |
1299.77 |
1287.69 - 1300.38 |
0.9295 times |
Mon 01 December 2025 |
1295.42 (-0.71%) |
1298.79 |
1293.35 - 1309.52 |
0.8962 times |
Fri 28 November 2025 |
1304.67 (0.02%) |
1307.34 |
1303.66 - 1309.95 |
0.4685 times |
Wed 26 November 2025 |
1304.40 (0.42%) |
1297.09 |
1296.74 - 1311.52 |
0.9137 times |
Tue 25 November 2025 |
1298.95 (2.03%) |
1279.30 |
1279.30 - 1302.97 |
1.1366 times |
Mon 24 November 2025 |
1273.06 (-0.26%) |
1276.18 |
1271.31 - 1283.60 |
1.3968 times |
Fri 21 November 2025 |
1276.33 (2.53%) |
1247.39 |
1245.60 - 1281.11 |
1.1652 times |
Thu 20 November 2025 |
1244.82 (-0.17%) |
1260.20 |
1240.84 - 1267.14 |
1.0731 times |
Wed 19 November 2025 |
1246.94 (0.07%) |
1247.69 |
1242.95 - 1253.77 |
0.9002 times |
Weekly price and charts DjUs Strong weekly Stock price targets for DjUs DSFE are 1299.91 and 1328.9 | Weekly Target 1 | 1276.51 | | Weekly Target 2 | 1294.31 | | Weekly Target 3 | 1305.4966666667 | | Weekly Target 4 | 1323.3 | | Weekly Target 5 | 1334.49 |
Weekly price and volumes for Dj Us
| Date |
Closing |
Open |
Range |
Volume |
Thu 04 December 2025 |
1312.12 (0.57%) |
1298.79 |
1287.69 - 1316.68 |
0.9237 times |
Fri 28 November 2025 |
1304.67 (2.22%) |
1276.18 |
1271.31 - 1311.52 |
0.9404 times |
Fri 21 November 2025 |
1276.33 (0.7%) |
1266.76 |
1237.20 - 1281.11 |
1.2161 times |
Fri 14 November 2025 |
1267.52 (-1.83%) |
1295.68 |
1266.45 - 1313.20 |
1.0393 times |
Fri 07 November 2025 |
1291.13 (1.99%) |
1251.36 |
1249.02 - 1302.85 |
0.9542 times |
Fri 31 October 2025 |
1265.89 (0%) |
1262.22 |
1258.86 - 1273.16 |
0.3332 times |
Fri 31 October 2025 |
1265.89 (0.14%) |
1270.44 |
1258.86 - 1291.00 |
1.6549 times |
Fri 24 October 2025 |
1264.06 (2.43%) |
1237.71 |
1237.71 - 1276.08 |
0.9192 times |
Fri 17 October 2025 |
1234.08 (2.22%) |
1210.22 |
1205.56 - 1247.40 |
1.0257 times |
Fri 10 October 2025 |
1207.33 (-5.04%) |
1274.55 |
1205.86 - 1277.43 |
0.9934 times |
Fri 03 October 2025 |
1271.40 (1.43%) |
1257.09 |
1251.26 - 1281.33 |
0.8049 times |

Monthly price and charts DjUs Strong monthly Stock price targets for DjUs DSFE are 1299.91 and 1328.9 | Monthly Target 1 | 1276.51 | | Monthly Target 2 | 1294.31 | | Monthly Target 3 | 1305.4966666667 | | Monthly Target 4 | 1323.3 | | Monthly Target 5 | 1334.49 |
Monthly price and volumes Dj Us
| Date |
Closing |
Open |
Range |
Volume |
Thu 04 December 2025 |
1312.12 (0.57%) |
1298.79 |
1287.69 - 1316.68 |
0.2083 times |
Fri 28 November 2025 |
1304.67 (3.06%) |
1251.36 |
1237.20 - 1313.20 |
0.9358 times |
Fri 31 October 2025 |
1265.89 (0.29%) |
1258.91 |
1205.56 - 1291.00 |
1.2026 times |
Tue 30 September 2025 |
1262.25 (0.84%) |
1237.34 |
1228.83 - 1275.73 |
1.0982 times |
Fri 29 August 2025 |
1251.73 (1.37%) |
1212.54 |
1193.49 - 1273.41 |
1.1397 times |
Thu 31 July 2025 |
1234.83 (2.18%) |
1204.46 |
1202.33 - 1262.80 |
1.1355 times |
Mon 30 June 2025 |
1208.45 (2.64%) |
1176.19 |
1150.65 - 1221.98 |
1.0137 times |
Fri 30 May 2025 |
1177.41 (5.83%) |
1119.42 |
1107.02 - 1215.07 |
1.1879 times |
Wed 30 April 2025 |
1112.58 (-3.26%) |
1147.91 |
969.18 - 1174.07 |
1.2055 times |
Mon 31 March 2025 |
1150.08 (-7.02%) |
1239.75 |
1119.45 - 1248.09 |
0.8728 times |
Fri 28 February 2025 |
1236.87 (-2.41%) |
1243.23 |
1216.17 - 1265.90 |
0.8776 times |

DMA SMA EMA moving averages of Dj Us DSFE
DMA (daily moving average) of Dj Us DSFE
| DMA period | DMA value | | 5 day DMA | 1303.01 | | 12 day DMA | 1283.81 | | 20 day DMA | 1283.51 | | 35 day DMA | 1273.09 | | 50 day DMA | 1265.03 | | 100 day DMA | 1254.66 | | 150 day DMA | 1231.91 | | 200 day DMA | 1214.83 | EMA (exponential moving average) of Dj Us DSFE
| EMA period | EMA current | EMA prev | EMA prev2 | | 5 day EMA | 1302.98 | 1298.41 | 1293.91 | | 12 day EMA | 1292.03 | 1288.38 | 1284.92 | | 20 day EMA | 1284.91 | 1282.05 | 1279.38 | | 35 day EMA | 1275.76 | 1273.62 | 1271.63 | | 50 day EMA | 1268.16 | 1266.37 | 1264.69 |
SMA (simple moving average) of Dj Us DSFE
| SMA period | SMA current | SMA prev | SMA prev2 | | 5 day SMA | 1303.01 | 1301.47 | 1299.78 | | 12 day SMA | 1283.81 | 1278.57 | 1275.25 | | 20 day SMA | 1283.51 | 1281.42 | 1279.02 | | 35 day SMA | 1273.09 | 1270.82 | 1268.72 | | 50 day SMA | 1265.03 | 1263.92 | 1262.95 | | 100 day SMA | 1254.66 | 1254.07 | 1253.43 | | 150 day SMA | 1231.91 | 1230.55 | 1229.17 | | 200 day SMA | 1214.83 | 1214.53 | 1214.25 |
|
|
