US DSEH full analysis,charts,indicators,moving averages,SMA,DMA,EMA,ADX,MACD,RSIU S DSEH WideScreen charts, DMA,SMA,EMA technical analysis, forecast prediction, by indicators ADX,MACD,RSI,CCI INDICES stock exchange
Daily price and charts and targets US Strong Daily Stock price targets for US DSEH are 55.74 and 57.84 | Daily Target 1 | 55.38 | | Daily Target 2 | 56.09 | | Daily Target 3 | 57.483333333333 | | Daily Target 4 | 58.19 | | Daily Target 5 | 59.58 |
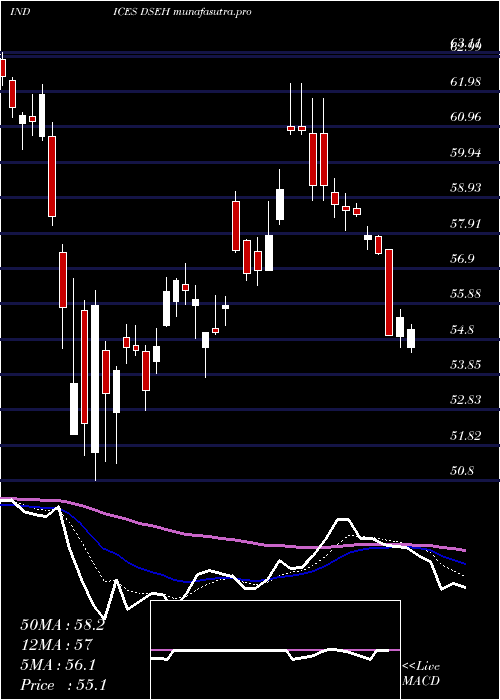
Daily price and volume U S
| Date |
Closing |
Open |
Range |
Volume |
Tue 15 July 2025 |
56.79 (-2.66%) |
58.68 |
56.78 - 58.88 |
0.941 times |
Mon 14 July 2025 |
58.34 (-0.03%) |
58.31 |
57.99 - 58.74 |
0.8255 times |
Fri 11 July 2025 |
58.36 (-0.82%) |
58.36 |
57.93 - 58.64 |
1.0499 times |
Thu 10 July 2025 |
58.84 (1.52%) |
57.91 |
57.77 - 59.22 |
1.2175 times |
Wed 09 July 2025 |
57.96 (1.08%) |
57.63 |
57.23 - 58.00 |
0.9323 times |
Tue 08 July 2025 |
57.34 (0.9%) |
56.87 |
56.69 - 57.83 |
1.2245 times |
Mon 07 July 2025 |
56.83 (-0.32%) |
56.81 |
56.38 - 57.32 |
1.1459 times |
Thu 03 July 2025 |
57.01 (-0.11%) |
56.93 |
56.72 - 57.29 |
0.5298 times |
Wed 02 July 2025 |
57.07 (1.12%) |
56.62 |
55.97 - 57.17 |
0.9057 times |
Tue 01 July 2025 |
56.44 (1.07%) |
55.66 |
55.32 - 56.96 |
1.2278 times |
Mon 30 June 2025 |
55.84 (-0.48%) |
56.02 |
54.98 - 56.02 |
1.415 times |
Weekly price and charts US Strong weekly Stock price targets for US DSEH are 55.74 and 57.84 | Weekly Target 1 | 55.38 | | Weekly Target 2 | 56.09 | | Weekly Target 3 | 57.483333333333 | | Weekly Target 4 | 58.19 | | Weekly Target 5 | 59.58 |
Weekly price and volumes for U S
| Date |
Closing |
Open |
Range |
Volume |
Tue 15 July 2025 |
56.79 (-2.69%) |
58.31 |
56.78 - 58.88 |
0.3406 times |
Fri 11 July 2025 |
58.36 (2.37%) |
56.81 |
56.38 - 59.22 |
1.0739 times |
Thu 03 July 2025 |
57.01 (1.6%) |
56.02 |
54.98 - 57.29 |
0.7863 times |
Fri 27 June 2025 |
56.11 (-2.08%) |
56.34 |
54.00 - 56.78 |
1.4938 times |
Fri 20 June 2025 |
57.30 (-0.17%) |
57.99 |
57.11 - 58.33 |
0.5618 times |
Fri 13 June 2025 |
57.40 (1.09%) |
57.50 |
56.80 - 58.73 |
1.0087 times |
Fri 06 June 2025 |
56.78 (0.48%) |
56.49 |
55.46 - 56.92 |
0.8834 times |
Fri 30 May 2025 |
56.51 (2.5%) |
55.62 |
55.25 - 57.56 |
0.922 times |
Fri 23 May 2025 |
55.13 (-5.7%) |
57.72 |
54.49 - 58.09 |
1.5279 times |
Fri 16 May 2025 |
58.46 (-1.37%) |
60.78 |
58.00 - 61.79 |
1.4017 times |
Tue 13 May 2025 |
59.27 (-2.6%) |
60.98 |
58.84 - 62.20 |
0.9734 times |
Monthly price and charts US Strong monthly Stock price targets for US DSEH are 56.06 and 59.96 | Monthly Target 1 | 53.21 | | Monthly Target 2 | 55 | | Monthly Target 3 | 57.11 | | Monthly Target 4 | 58.9 | | Monthly Target 5 | 61.01 |
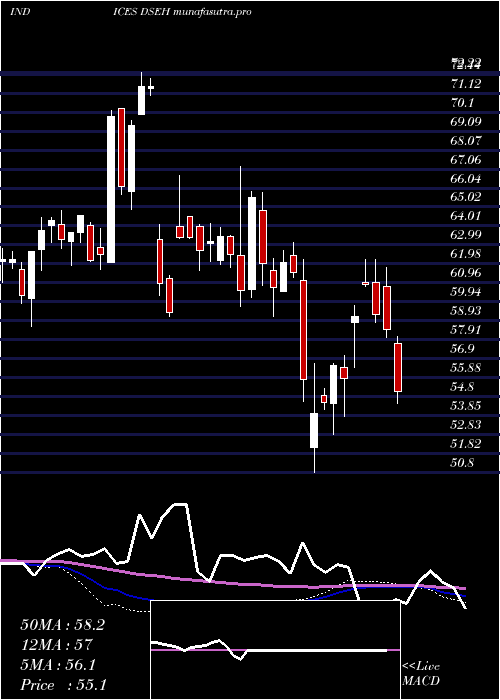
Monthly price and volumes U S
| Date |
Closing |
Open |
Range |
Volume |
Tue 15 July 2025 |
56.79 (1.7%) |
55.66 |
55.32 - 59.22 |
0.5589 times |
Mon 30 June 2025 |
55.84 (-1.19%) |
56.49 |
54.00 - 58.73 |
1.2236 times |
Fri 30 May 2025 |
56.51 (2.67%) |
55.18 |
54.49 - 62.20 |
2.4278 times |
Wed 30 April 2025 |
55.04 (-10.18%) |
61.27 |
50.80 - 62.18 |
0.7554 times |
Mon 31 March 2025 |
61.28 (-6.47%) |
64.81 |
59.15 - 65.80 |
0.7012 times |
Fri 28 February 2025 |
65.52 (3.7%) |
62.14 |
59.66 - 67.17 |
1.6196 times |
Fri 31 January 2025 |
63.18 (-11.61%) |
63.29 |
59.14 - 66.71 |
1.0471 times |
Tue 26 November 2024 |
71.48 (13.62%) |
63.34 |
62.04 - 72.22 |
0.6432 times |
Thu 31 October 2024 |
62.91 (-1.8%) |
63.75 |
61.68 - 64.58 |
0.5132 times |
Mon 30 September 2024 |
64.06 (2.94%) |
61.64 |
58.63 - 64.82 |
0.51 times |
Fri 30 August 2024 |
62.23 (5.89%) |
61.51 |
49.50 - 62.79 |
1.1957 times |

DMA SMA EMA moving averages of U S DSEH
DMA (daily moving average) of U S DSEH
| DMA period | DMA value | | 5 day DMA | 58.06 | | 12 day DMA | 57.24 | | 20 day DMA | 56.92 | | 35 day DMA | 56.8 | | 50 day DMA | 57.24 | | 100 day DMA | 58.39 | | 150 day DMA | 60.47 | | 200 day DMA | 60.96 | EMA (exponential moving average) of U S DSEH
| EMA period | EMA current | EMA prev | EMA prev2 | | 5 day EMA | 57.66 | 58.1 | 57.98 | | 12 day EMA | 57.4 | 57.51 | 57.36 | | 20 day EMA | 57.21 | 57.25 | 57.13 | | 35 day EMA | 57.12 | 57.14 | 57.07 | | 50 day EMA | 57.19 | 57.21 | 57.16 |
SMA (simple moving average) of U S DSEH
| SMA period | SMA current | SMA prev | SMA prev2 | | 5 day SMA | 58.06 | 58.17 | 57.87 | | 12 day SMA | 57.24 | 57.15 | 56.83 | | 20 day SMA | 56.92 | 57 | 56.99 | | 35 day SMA | 56.8 | 56.75 | 56.72 | | 50 day SMA | 57.24 | 57.22 | 57.16 | | 100 day SMA | 58.39 | 58.44 | 58.49 | | 150 day SMA | 60.47 | 60.52 | 60.55 | | 200 day SMA | 60.96 | 60.97 | 60.97 |
|
|
