US DSDT full analysis,charts,indicators,moving averages,SMA,DMA,EMA,ADX,MACD,RSIU S DSDT WideScreen charts, DMA,SMA,EMA technical analysis, forecast prediction, by indicators ADX,MACD,RSI,CCI INDICES stock exchange
Daily price and charts and targets US Strong Daily Stock price targets for US DSDT are 57.1 and 58.67 | Daily Target 1 | 56.79 | | Daily Target 2 | 57.41 | | Daily Target 3 | 58.356666666667 | | Daily Target 4 | 58.98 | | Daily Target 5 | 59.93 |
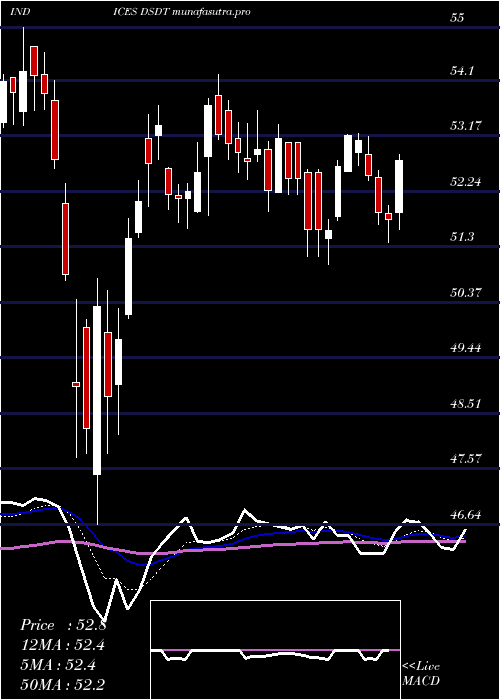
Daily price and volume U S
| Date |
Closing |
Open |
Range |
Volume |
Tue 21 October 2025 |
58.04 (-1.71%) |
59.21 |
57.73 - 59.30 |
1.2386 times |
Mon 20 October 2025 |
59.05 (0.32%) |
58.99 |
58.41 - 59.24 |
0.9065 times |
Fri 17 October 2025 |
58.86 (0.41%) |
58.81 |
58.31 - 58.98 |
1.1107 times |
Thu 16 October 2025 |
58.62 (0%) |
58.66 |
58.31 - 59.18 |
1.0187 times |
Wed 15 October 2025 |
58.62 (0.74%) |
58.18 |
58.12 - 58.81 |
1.0243 times |
Tue 14 October 2025 |
58.19 (0.22%) |
57.96 |
57.96 - 58.63 |
1.1888 times |
Mon 13 October 2025 |
58.06 (1.01%) |
57.38 |
57.29 - 58.12 |
0.7866 times |
Fri 10 October 2025 |
57.48 (-0.31%) |
57.77 |
57.41 - 58.09 |
0.7929 times |
Thu 09 October 2025 |
57.66 (-0.24%) |
57.80 |
57.50 - 58.31 |
0.7683 times |
Wed 08 October 2025 |
57.80 (-1.43%) |
58.63 |
57.74 - 58.66 |
1.1645 times |
Tue 07 October 2025 |
58.64 (0.05%) |
58.61 |
58.36 - 58.90 |
1.0513 times |
Weekly price and charts US Strong weekly Stock price targets for US DSDT are 57.1 and 58.67 | Weekly Target 1 | 56.79 | | Weekly Target 2 | 57.41 | | Weekly Target 3 | 58.356666666667 | | Weekly Target 4 | 58.98 | | Weekly Target 5 | 59.93 |
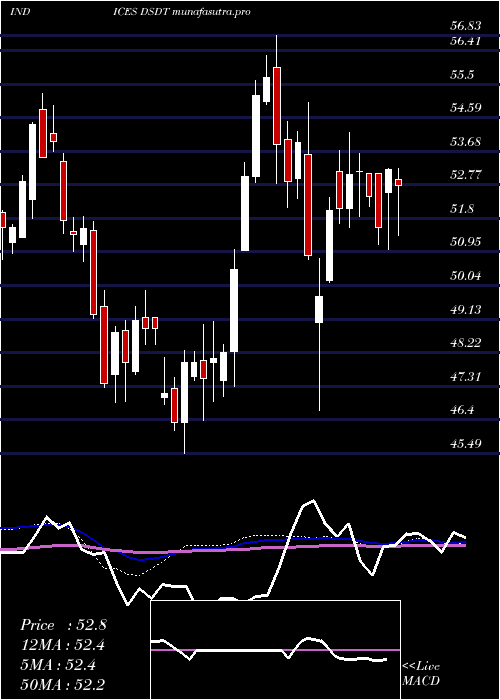
Weekly price and volumes for U S
| Date |
Closing |
Open |
Range |
Volume |
Tue 21 October 2025 |
58.04 (-1.39%) |
58.99 |
57.73 - 59.30 |
0.4185 times |
Fri 17 October 2025 |
58.86 (2.4%) |
57.38 |
57.29 - 59.18 |
1.0006 times |
Fri 10 October 2025 |
57.48 (-3.38%) |
59.10 |
57.41 - 59.24 |
1.0232 times |
Fri 03 October 2025 |
59.49 (1.09%) |
58.93 |
57.76 - 60.00 |
1.0939 times |
Fri 26 September 2025 |
58.85 (1.9%) |
58.01 |
57.48 - 59.10 |
1.1915 times |
Fri 19 September 2025 |
57.75 (-2.22%) |
59.15 |
57.72 - 59.32 |
1.6669 times |
Fri 12 September 2025 |
59.06 (0.85%) |
58.09 |
57.60 - 59.30 |
1.1087 times |
Fri 05 September 2025 |
58.56 (1.51%) |
57.37 |
56.49 - 58.70 |
0.9181 times |
Fri 29 August 2025 |
57.69 (0%) |
57.27 |
57.16 - 57.69 |
0.1861 times |
Fri 29 August 2025 |
57.69 (1.5%) |
56.74 |
56.44 - 57.70 |
1.3927 times |
Fri 22 August 2025 |
56.84 (1.52%) |
56.01 |
55.54 - 57.95 |
1.3229 times |
Monthly price and charts US Strong monthly Stock price targets for US DSDT are 56.31 and 59.02 | Monthly Target 1 | 55.73 | | Monthly Target 2 | 56.89 | | Monthly Target 3 | 58.443333333333 | | Monthly Target 4 | 59.6 | | Monthly Target 5 | 61.15 |
Monthly price and volumes U S
| Date |
Closing |
Open |
Range |
Volume |
Tue 21 October 2025 |
58.04 (-0.09%) |
58.25 |
57.29 - 60.00 |
0.5922 times |
Tue 30 September 2025 |
58.09 (0.69%) |
57.37 |
56.49 - 59.32 |
1.0567 times |
Fri 29 August 2025 |
57.69 (4.59%) |
55.53 |
55.09 - 57.95 |
1.0592 times |
Thu 31 July 2025 |
55.16 (2.85%) |
53.53 |
52.81 - 57.29 |
1.1153 times |
Mon 30 June 2025 |
53.63 (-0.61%) |
53.45 |
52.55 - 55.62 |
1.0334 times |
Fri 30 May 2025 |
53.96 (0.52%) |
53.85 |
51.02 - 54.79 |
1.1473 times |
Wed 30 April 2025 |
53.68 (-1.07%) |
54.67 |
46.64 - 54.67 |
0.9556 times |
Mon 31 March 2025 |
54.26 (-1.7%) |
55.03 |
52.14 - 56.83 |
1.1668 times |
Fri 28 February 2025 |
55.20 (14.83%) |
47.45 |
47.02 - 55.61 |
1.0431 times |
Fri 31 January 2025 |
48.07 (-1.64%) |
46.99 |
45.49 - 49.06 |
0.8304 times |
Tue 26 November 2024 |
48.87 (2.03%) |
48.27 |
46.86 - 49.89 |
0.9313 times |

DMA SMA EMA moving averages of U S DSDT
DMA (daily moving average) of U S DSDT
| DMA period | DMA value | | 5 day DMA | 58.64 | | 12 day DMA | 58.3 | | 20 day DMA | 58.38 | | 35 day DMA | 58.27 | | 50 day DMA | 57.82 | | 100 day DMA | 56.13 | | 150 day DMA | 54.93 | | 200 day DMA | 53.58 | EMA (exponential moving average) of U S DSDT
| EMA period | EMA current | EMA prev | EMA prev2 | | 5 day EMA | 58.48 | 58.7 | 58.53 | | 12 day EMA | 58.41 | 58.48 | 58.38 | | 20 day EMA | 58.32 | 58.35 | 58.28 | | 35 day EMA | 58.04 | 58.04 | 57.98 | | 50 day EMA | 57.79 | 57.78 | 57.73 |
SMA (simple moving average) of U S DSDT
| SMA period | SMA current | SMA prev | SMA prev2 | | 5 day SMA | 58.64 | 58.67 | 58.47 | | 12 day SMA | 58.3 | 58.42 | 58.41 | | 20 day SMA | 58.38 | 58.36 | 58.29 | | 35 day SMA | 58.27 | 58.26 | 58.22 | | 50 day SMA | 57.82 | 57.78 | 57.74 | | 100 day SMA | 56.13 | 56.07 | 56 | | 150 day SMA | 54.93 | 54.91 | 54.89 | | 200 day SMA | 53.58 | 53.53 | 53.47 |
|
|
