DjUs DSCY full analysis,charts,indicators,moving averages,SMA,DMA,EMA,ADX,MACD,RSIDj Us DSCY WideScreen charts, DMA,SMA,EMA technical analysis, forecast prediction, by indicators ADX,MACD,RSI,CCI INDICES stock exchange
Daily price and charts and targets DjUs Strong Daily Stock price targets for DjUs DSCY are 1993.91 and 2018.36 | Daily Target 1 | 1988 | | Daily Target 2 | 1999.82 | | Daily Target 3 | 2012.45 | | Daily Target 4 | 2024.27 | | Daily Target 5 | 2036.9 |
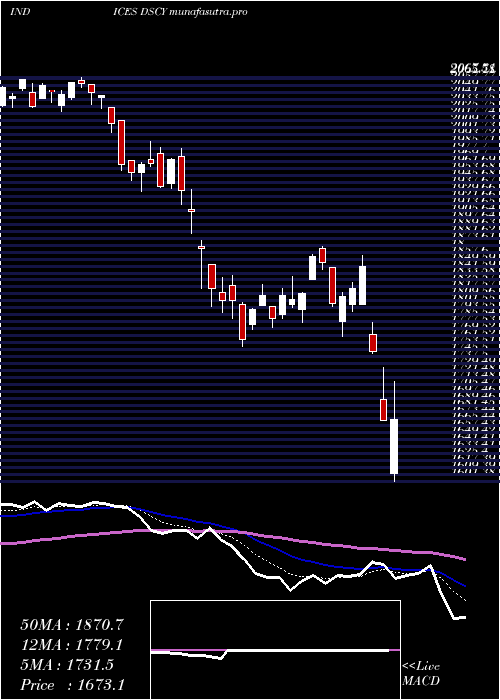
Daily price and volume Dj Us
| Date |
Closing |
Open |
Range |
Volume |
Thu 04 December 2025 |
2011.64 (-0.78%) |
2023.70 |
2000.63 - 2025.08 |
0.9785 times |
Wed 03 December 2025 |
2027.49 (-0.13%) |
2024.50 |
2019.76 - 2030.35 |
0.9319 times |
Tue 02 December 2025 |
2030.21 (0.14%) |
2030.90 |
2020.46 - 2038.61 |
0.9506 times |
Mon 01 December 2025 |
2027.38 (0.08%) |
2021.80 |
2017.07 - 2039.30 |
0.9559 times |
Fri 28 November 2025 |
2025.70 (0.97%) |
2012.60 |
2011.30 - 2026.61 |
0.4634 times |
Wed 26 November 2025 |
2006.26 (0.64%) |
1998.97 |
1997.25 - 2018.11 |
0.9911 times |
Tue 25 November 2025 |
1993.59 (1.76%) |
1960.33 |
1959.40 - 1995.52 |
1.0578 times |
Mon 24 November 2025 |
1959.12 (0.25%) |
1959.12 |
1955.12 - 1966.61 |
1.3407 times |
Fri 21 November 2025 |
1954.32 (1.59%) |
1928.56 |
1927.65 - 1965.08 |
1.1959 times |
Thu 20 November 2025 |
1923.78 (-1.27%) |
1966.85 |
1922.35 - 1976.86 |
1.1342 times |
Wed 19 November 2025 |
1948.59 (-0.57%) |
1962.92 |
1937.94 - 1962.92 |
0.9266 times |
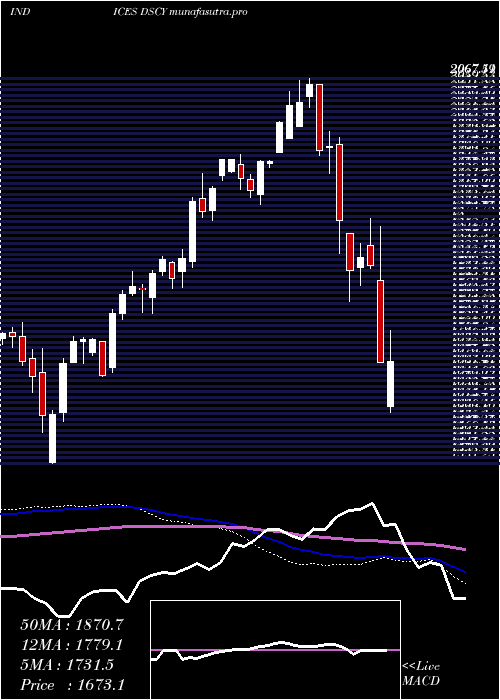
Weekly price and charts DjUs Strong weekly Stock price targets for DjUs DSCY are 1986.8 and 2025.47 | Weekly Target 1 | 1978.52 | | Weekly Target 2 | 1995.08 | | Weekly Target 3 | 2017.19 | | Weekly Target 4 | 2033.75 | | Weekly Target 5 | 2055.86 |
Weekly price and volumes for Dj Us
| Date |
Closing |
Open |
Range |
Volume |
Thu 04 December 2025 |
2011.64 (-0.69%) |
2021.80 |
2000.63 - 2039.30 |
0.9105 times |
Fri 28 November 2025 |
2025.70 (3.65%) |
1959.12 |
1955.12 - 2026.61 |
0.9191 times |
Fri 21 November 2025 |
1954.32 (-2.87%) |
2004.86 |
1922.35 - 2010.14 |
1.2487 times |
Fri 14 November 2025 |
2012.10 (-1.49%) |
2056.94 |
2008.41 - 2077.53 |
1.1175 times |
Fri 07 November 2025 |
2042.53 (-0.44%) |
2060.61 |
2015.50 - 2071.04 |
1.1278 times |
Fri 31 October 2025 |
2051.47 (0%) |
2066.87 |
2050.19 - 2067.95 |
0.3034 times |
Fri 31 October 2025 |
2051.47 (1.18%) |
2043.44 |
1993.57 - 2067.95 |
1.2594 times |
Fri 24 October 2025 |
2027.64 (0.96%) |
2016.02 |
2012.06 - 2055.00 |
0.977 times |
Fri 17 October 2025 |
2008.28 (0.96%) |
1995.35 |
1989.36 - 2043.45 |
1.0006 times |
Fri 10 October 2025 |
1989.21 (-1.95%) |
2029.89 |
1989.18 - 2043.70 |
1.1361 times |
Fri 03 October 2025 |
2028.78 (-1.07%) |
2052.69 |
2027.52 - 2060.52 |
1.0069 times |
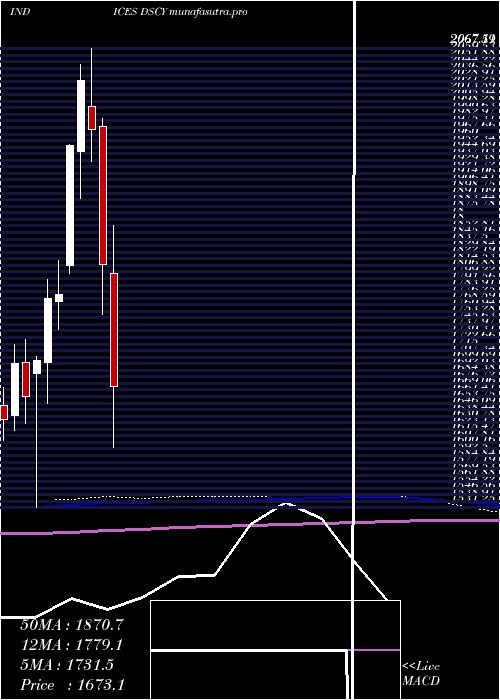
Monthly price and charts DjUs Strong monthly Stock price targets for DjUs DSCY are 1986.8 and 2025.47 | Monthly Target 1 | 1978.52 | | Monthly Target 2 | 1995.08 | | Monthly Target 3 | 2017.19 | | Monthly Target 4 | 2033.75 | | Monthly Target 5 | 2055.86 |
Monthly price and volumes Dj Us
| Date |
Closing |
Open |
Range |
Volume |
Thu 04 December 2025 |
2011.64 (-0.69%) |
2021.80 |
2000.63 - 2039.30 |
0.2065 times |
Fri 28 November 2025 |
2025.70 (-1.26%) |
2060.61 |
1922.35 - 2077.53 |
1.0008 times |
Fri 31 October 2025 |
2051.47 (0.25%) |
2034.08 |
1989.18 - 2067.95 |
1.1631 times |
Tue 30 September 2025 |
2046.30 (-1.66%) |
2056.09 |
2036.29 - 2124.73 |
1.2331 times |
Fri 29 August 2025 |
2080.79 (1.55%) |
1996.49 |
1982.75 - 2095.29 |
1.0973 times |
Thu 31 July 2025 |
2049.06 (0.36%) |
2040.29 |
2023.95 - 2080.66 |
1.0163 times |
Mon 30 June 2025 |
2041.81 (4.22%) |
1955.17 |
1939.30 - 2050.18 |
1.0097 times |
Fri 30 May 2025 |
1959.13 (6.58%) |
1850.79 |
1845.63 - 1986.31 |
1.209 times |
Wed 30 April 2025 |
1838.25 (1.29%) |
1805.09 |
1601.38 - 1861.16 |
1.0725 times |
Mon 31 March 2025 |
1814.88 (-8%) |
1975.97 |
1756.83 - 1985.62 |
0.9917 times |
Fri 28 February 2025 |
1972.72 (-2.83%) |
2000.29 |
1935.21 - 2067.51 |
0.8982 times |
DMA SMA EMA moving averages of Dj Us DSCY
DMA (daily moving average) of Dj Us DSCY
| DMA period | DMA value | | 5 day DMA | 2024.48 | | 12 day DMA | 1988.98 | | 20 day DMA | 2008.23 | | 35 day DMA | 2018.19 | | 50 day DMA | 2022.61 | | 100 day DMA | 2046.63 | | 150 day DMA | 2020.52 | | 200 day DMA | 1982.44 | EMA (exponential moving average) of Dj Us DSCY
| EMA period | EMA current | EMA prev | EMA prev2 | | 5 day EMA | 2016.61 | 2019.1 | 2014.9 | | 12 day EMA | 2008.94 | 2008.45 | 2004.99 | | 20 day EMA | 2010.33 | 2010.19 | 2008.37 | | 35 day EMA | 2016.48 | 2016.76 | 2016.13 | | 50 day EMA | 2027.42 | 2028.06 | 2028.08 |
SMA (simple moving average) of Dj Us DSCY
| SMA period | SMA current | SMA prev | SMA prev2 | | 5 day SMA | 2024.48 | 2023.41 | 2016.63 | | 12 day SMA | 1988.98 | 1987.43 | 1986.14 | | 20 day SMA | 2008.23 | 2010.63 | 2012.22 | | 35 day SMA | 2018.19 | 2018.58 | 2018.51 | | 50 day SMA | 2022.61 | 2023.48 | 2024.41 | | 100 day SMA | 2046.63 | 2047.07 | 2047.36 | | 150 day SMA | 2020.52 | 2019.38 | 2018.06 | | 200 day SMA | 1982.44 | 1982.61 | 1982.75 |
|
|
