DjUs DSCN full analysis,charts,indicators,moving averages,SMA,DMA,EMA,ADX,MACD,RSIDj Us DSCN WideScreen charts, DMA,SMA,EMA technical analysis, forecast prediction, by indicators ADX,MACD,RSI,CCI INDICES stock exchange
Daily price and charts and targets DjUs Strong Daily Stock price targets for DjUs DSCN are 2043.78 and 2070.49 | Daily Target 1 | 2022.75 | | Daily Target 2 | 2038.09 | | Daily Target 3 | 2049.4566666667 | | Daily Target 4 | 2064.8 | | Daily Target 5 | 2076.17 |
Daily price and volume Dj Us
| Date |
Closing |
Open |
Range |
Volume |
Thu 04 December 2025 |
2053.44 (0.22%) |
2037.74 |
2034.11 - 2060.82 |
0.9095 times |
Wed 03 December 2025 |
2048.89 (0.81%) |
2032.17 |
2025.66 - 2051.65 |
0.8501 times |
Tue 02 December 2025 |
2032.44 (-0.46%) |
2053.11 |
2024.62 - 2053.68 |
0.8133 times |
Mon 01 December 2025 |
2041.88 (-1.14%) |
2060.42 |
2034.53 - 2061.73 |
0.8588 times |
Fri 28 November 2025 |
2065.36 (0.45%) |
2062.05 |
2054.10 - 2069.27 |
0.3966 times |
Wed 26 November 2025 |
2056.06 (1.16%) |
2032.36 |
2032.36 - 2067.87 |
0.9701 times |
Tue 25 November 2025 |
2032.55 (2.26%) |
1996.84 |
1981.76 - 2034.27 |
1.1325 times |
Mon 24 November 2025 |
1987.71 (1.04%) |
1967.26 |
1966.77 - 1997.59 |
1.8302 times |
Fri 21 November 2025 |
1967.24 (1.93%) |
1937.31 |
1928.95 - 1975.72 |
1.1917 times |
Thu 20 November 2025 |
1930.06 (-1.62%) |
1983.63 |
1927.62 - 1998.85 |
1.0471 times |
Wed 19 November 2025 |
1961.88 (0.15%) |
1968.90 |
1955.20 - 1978.11 |
0.8703 times |
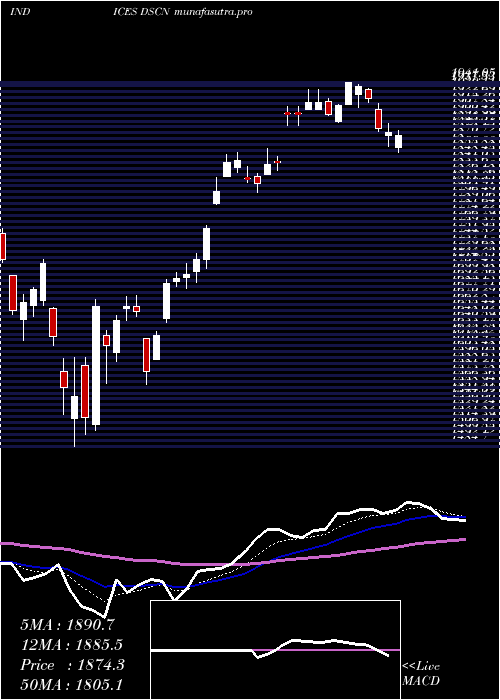
Weekly price and charts DjUs Strong weekly Stock price targets for DjUs DSCN are 2020.48 and 2057.59 | Weekly Target 1 | 2009.49 | | Weekly Target 2 | 2031.46 | | Weekly Target 3 | 2046.5966666667 | | Weekly Target 4 | 2068.57 | | Weekly Target 5 | 2083.71 |
Weekly price and volumes for Dj Us
| Date |
Closing |
Open |
Range |
Volume |
Thu 04 December 2025 |
2053.44 (-0.58%) |
2060.42 |
2024.62 - 2061.73 |
0.8878 times |
Fri 28 November 2025 |
2065.36 (4.99%) |
1967.26 |
1966.77 - 2069.27 |
1.12 times |
Fri 21 November 2025 |
1967.24 (-1.27%) |
1989.10 |
1927.62 - 1998.85 |
1.3103 times |
Fri 14 November 2025 |
1992.56 (-3.14%) |
2060.82 |
1984.87 - 2083.23 |
1.1374 times |
Fri 07 November 2025 |
2057.05 (-1.97%) |
2059.46 |
2025.26 - 2083.16 |
1.2037 times |
Fri 31 October 2025 |
2098.33 (0%) |
2083.08 |
2083.08 - 2106.92 |
0.2569 times |
Fri 31 October 2025 |
2098.33 (0.4%) |
2106.46 |
2072.01 - 2140.56 |
1.2491 times |
Fri 24 October 2025 |
2089.94 (2.4%) |
2046.91 |
2017.66 - 2101.53 |
0.9611 times |
Fri 17 October 2025 |
2041.03 (1.32%) |
2025.92 |
2016.69 - 2092.65 |
0.9414 times |
Fri 10 October 2025 |
2014.34 (-2.79%) |
2085.52 |
2013.75 - 2085.68 |
0.9322 times |
Fri 03 October 2025 |
2072.21 (2.37%) |
2030.62 |
2024.24 - 2081.64 |
0.761 times |

Monthly price and charts DjUs Strong monthly Stock price targets for DjUs DSCN are 2020.48 and 2057.59 | Monthly Target 1 | 2009.49 | | Monthly Target 2 | 2031.46 | | Monthly Target 3 | 2046.5966666667 | | Monthly Target 4 | 2068.57 | | Monthly Target 5 | 2083.71 |
Monthly price and volumes Dj Us
| Date |
Closing |
Open |
Range |
Volume |
Thu 04 December 2025 |
2053.44 (-0.58%) |
2060.42 |
2024.62 - 2061.73 |
0.2167 times |
Fri 28 November 2025 |
2065.36 (-1.57%) |
2059.46 |
1927.62 - 2083.23 |
1.1648 times |
Fri 31 October 2025 |
2098.33 (1.62%) |
2062.43 |
2013.75 - 2140.56 |
1.1488 times |
Tue 30 September 2025 |
2064.98 (0.61%) |
2017.45 |
1981.34 - 2099.78 |
1.1351 times |
Fri 29 August 2025 |
2052.48 (2.37%) |
1983.52 |
1954.83 - 2096.49 |
1.1054 times |
Thu 31 July 2025 |
2004.91 (3.76%) |
1924.39 |
1919.31 - 2096.84 |
1.0062 times |
Mon 30 June 2025 |
1932.25 (2.51%) |
1879.33 |
1842.71 - 1944.63 |
0.9805 times |
Fri 30 May 2025 |
1884.94 (7.22%) |
1789.24 |
1787.98 - 1941.05 |
1.1879 times |
Wed 30 April 2025 |
1758.08 (5.55%) |
1661.29 |
1484.70 - 1762.04 |
0.9839 times |
Mon 31 March 2025 |
1665.70 (-5.96%) |
1777.49 |
1617.48 - 1785.57 |
1.0707 times |
Fri 28 February 2025 |
1771.27 (-4.44%) |
1816.24 |
1739.83 - 1885.50 |
1.0139 times |

DMA SMA EMA moving averages of Dj Us DSCN
DMA (daily moving average) of Dj Us DSCN
| DMA period | DMA value | | 5 day DMA | 2048.4 | | 12 day DMA | 2011.37 | | 20 day DMA | 2019.58 | | 35 day DMA | 2042.66 | | 50 day DMA | 2044.04 | | 100 day DMA | 2040.96 | | 150 day DMA | 1993.36 | | 200 day DMA | 1924.72 | EMA (exponential moving average) of Dj Us DSCN
| EMA period | EMA current | EMA prev | EMA prev2 | | 5 day EMA | 2043.73 | 2038.88 | 2033.88 | | 12 day EMA | 2031.09 | 2027.03 | 2023.06 | | 20 day EMA | 2030.21 | 2027.77 | 2025.55 | | 35 day EMA | 2032.48 | 2031.25 | 2030.21 | | 50 day EMA | 2043.67 | 2043.27 | 2043.04 |
SMA (simple moving average) of Dj Us DSCN
| SMA period | SMA current | SMA prev | SMA prev2 | | 5 day SMA | 2048.4 | 2048.93 | 2045.66 | | 12 day SMA | 2011.37 | 2004.22 | 1999.52 | | 20 day SMA | 2019.58 | 2020.43 | 2020.85 | | 35 day SMA | 2042.66 | 2043.03 | 2043.57 | | 50 day SMA | 2044.04 | 2043.58 | 2043.52 | | 100 day SMA | 2040.96 | 2040.4 | 2039.8 | | 150 day SMA | 1993.36 | 1991.13 | 1988.8 | | 200 day SMA | 1924.72 | 1923.72 | 1922.6 |
|
|
