DjUs DSCG full analysis,charts,indicators,moving averages,SMA,DMA,EMA,ADX,MACD,RSIDj Us DSCG WideScreen charts, DMA,SMA,EMA technical analysis, forecast prediction, by indicators ADX,MACD,RSI,CCI INDICES stock exchange
Daily price and charts and targets DjUs Strong Daily Stock price targets for DjUs DSCG are 1894.17 and 1915.21 | Daily Target 1 | 1878.08 | | Daily Target 2 | 1889.22 | | Daily Target 3 | 1899.1166666667 | | Daily Target 4 | 1910.26 | | Daily Target 5 | 1920.16 |
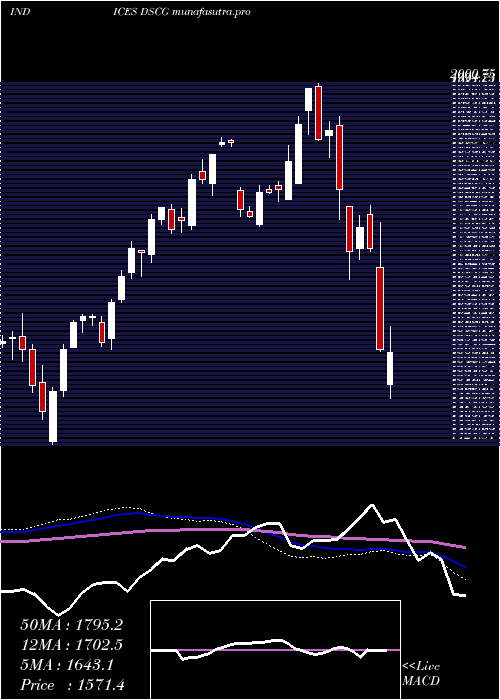
Daily price and volume Dj Us
| Date |
Closing |
Open |
Range |
Volume |
Fri 05 December 2025 |
1900.37 (0.61%) |
1888.18 |
1887.97 - 1909.01 |
0.9305 times |
Thu 04 December 2025 |
1888.77 (-0.68%) |
1896.92 |
1880.87 - 1903.07 |
0.9427 times |
Wed 03 December 2025 |
1901.78 (1.21%) |
1885.26 |
1883.62 - 1909.98 |
0.9945 times |
Tue 02 December 2025 |
1878.98 (0.89%) |
1864.60 |
1850.63 - 1886.63 |
0.9717 times |
Mon 01 December 2025 |
1862.36 (-0.67%) |
1864.19 |
1861.40 - 1876.03 |
1.0298 times |
Fri 28 November 2025 |
1874.89 (0.6%) |
1869.87 |
1866.73 - 1879.86 |
0.4966 times |
Wed 26 November 2025 |
1863.75 (0.67%) |
1853.03 |
1853.03 - 1872.50 |
1.0044 times |
Tue 25 November 2025 |
1851.28 (2.52%) |
1812.62 |
1812.27 - 1853.52 |
1.192 times |
Mon 24 November 2025 |
1805.73 (-0.58%) |
1820.34 |
1800.74 - 1823.84 |
1.2041 times |
Fri 21 November 2025 |
1816.20 (2.82%) |
1777.81 |
1777.47 - 1823.92 |
1.2337 times |
Thu 20 November 2025 |
1766.33 (-2.19%) |
1813.58 |
1765.31 - 1820.28 |
1.1569 times |

Weekly price and charts DjUs Strong weekly Stock price targets for DjUs DSCG are 1875.5 and 1934.85 | Weekly Target 1 | 1827.64 | | Weekly Target 2 | 1864.01 | | Weekly Target 3 | 1886.9933333333 | | Weekly Target 4 | 1923.36 | | Weekly Target 5 | 1946.34 |
Weekly price and volumes for Dj Us
| Date |
Closing |
Open |
Range |
Volume |
Fri 05 December 2025 |
1900.37 (1.36%) |
1864.19 |
1850.63 - 1909.98 |
0.9752 times |
Fri 28 November 2025 |
1874.89 (3.23%) |
1820.34 |
1800.74 - 1879.86 |
0.7805 times |
Fri 21 November 2025 |
1816.20 (-1.94%) |
1850.23 |
1765.31 - 1852.91 |
1.0572 times |
Fri 14 November 2025 |
1852.17 (0.06%) |
1861.14 |
1838.90 - 1893.53 |
1.1068 times |
Fri 07 November 2025 |
1851.04 (-1.35%) |
1838.31 |
1815.19 - 1863.09 |
1.1997 times |
Fri 31 October 2025 |
1876.38 (0%) |
1881.81 |
1867.89 - 1885.00 |
0.2619 times |
Fri 31 October 2025 |
1876.38 (-3.36%) |
1955.11 |
1867.89 - 1965.13 |
1.2525 times |
Fri 24 October 2025 |
1941.56 (1.13%) |
1929.93 |
1929.09 - 1962.18 |
1.054 times |
Fri 17 October 2025 |
1919.90 (1.65%) |
1901.65 |
1897.93 - 1964.75 |
1.0758 times |
Fri 10 October 2025 |
1888.70 (-3.73%) |
1963.37 |
1887.99 - 1986.90 |
1.2364 times |
Fri 03 October 2025 |
1961.97 (-1.24%) |
2004.68 |
1940.88 - 2005.70 |
1.0454 times |
Monthly price and charts DjUs Strong monthly Stock price targets for DjUs DSCG are 1875.5 and 1934.85 | Monthly Target 1 | 1827.64 | | Monthly Target 2 | 1864.01 | | Monthly Target 3 | 1886.9933333333 | | Monthly Target 4 | 1923.36 | | Monthly Target 5 | 1946.34 |
Monthly price and volumes Dj Us
| Date |
Closing |
Open |
Range |
Volume |
Fri 05 December 2025 |
1900.37 (1.36%) |
1864.19 |
1850.63 - 1909.98 |
0.2316 times |
Fri 28 November 2025 |
1874.89 (-0.08%) |
1838.31 |
1765.31 - 1893.53 |
0.9841 times |
Fri 31 October 2025 |
1876.38 (-4.5%) |
1959.38 |
1867.89 - 1986.90 |
1.271 times |
Tue 30 September 2025 |
1964.89 (-3.31%) |
2005.11 |
1955.64 - 2030.08 |
1.2593 times |
Fri 29 August 2025 |
2032.25 (3.87%) |
1939.55 |
1911.23 - 2044.13 |
1.0192 times |
Thu 31 July 2025 |
1956.48 (-0.96%) |
1972.71 |
1952.92 - 2050.51 |
1.0551 times |
Mon 30 June 2025 |
1975.43 (5.88%) |
1856.59 |
1833.15 - 1977.38 |
0.9737 times |
Fri 30 May 2025 |
1865.81 (6.14%) |
1754.86 |
1753.81 - 1907.75 |
1.2095 times |
Wed 30 April 2025 |
1757.94 (1.08%) |
1732.35 |
1498.58 - 1779.36 |
1.0458 times |
Mon 31 March 2025 |
1739.10 (-9.67%) |
1934.24 |
1687.30 - 1948.13 |
0.9508 times |
Fri 28 February 2025 |
1925.33 (2.63%) |
1840.77 |
1840.77 - 2000.75 |
0.875 times |
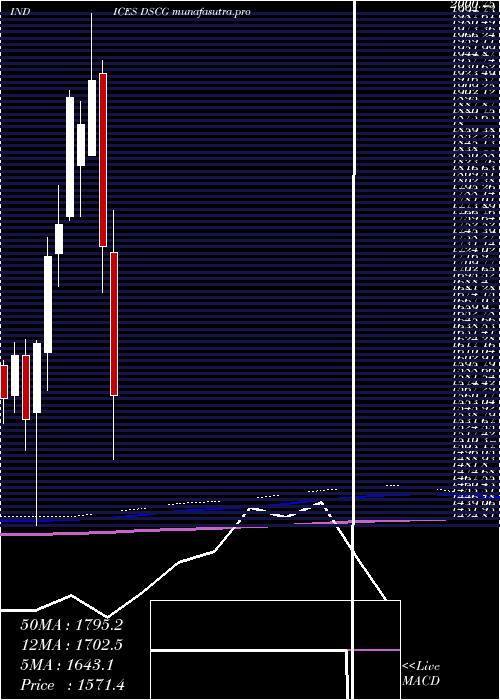
DMA SMA EMA moving averages of Dj Us DSCG
DMA (daily moving average) of Dj Us DSCG
| DMA period | DMA value | | 5 day DMA | 1886.45 | | 12 day DMA | 1851.36 | | 20 day DMA | 1851.91 | | 35 day DMA | 1874.76 | | 50 day DMA | 1895.68 | | 100 day DMA | 1945.67 | | 150 day DMA | 1928.21 | | 200 day DMA | 1894.13 | EMA (exponential moving average) of Dj Us DSCG
| EMA period | EMA current | EMA prev | EMA prev2 | | 5 day EMA | 1886.66 | 1879.8 | 1875.31 | | 12 day EMA | 1869 | 1863.3 | 1858.67 | | 20 day EMA | 1866.7 | 1863.16 | 1860.47 | | 35 day EMA | 1880.99 | 1879.85 | 1879.32 | | 50 day EMA | 1902.13 | 1902.2 | 1902.75 |
SMA (simple moving average) of Dj Us DSCG
| SMA period | SMA current | SMA prev | SMA prev2 | | 5 day SMA | 1886.45 | 1881.36 | 1876.35 | | 12 day SMA | 1851.36 | 1844.59 | 1838.76 | | 20 day SMA | 1851.91 | 1847.73 | 1845.95 | | 35 day SMA | 1874.76 | 1874.95 | 1876.27 | | 50 day SMA | 1895.68 | 1897.25 | 1899.23 | | 100 day SMA | 1945.67 | 1946.98 | 1948.51 | | 150 day SMA | 1928.21 | 1927.26 | 1926.34 | | 200 day SMA | 1894.13 | 1894.22 | 1894.17 |
|
|
