DjUs DSCA full analysis,charts,indicators,moving averages,SMA,DMA,EMA,ADX,MACD,RSIDj Us DSCA WideScreen charts, DMA,SMA,EMA technical analysis, forecast prediction, by indicators ADX,MACD,RSI,CCI INDICES stock exchange
Daily price and charts and targets DjUs Strong Daily Stock price targets for DjUs DSCA are 637.83 and 647.47 | Daily Target 1 | 635.97 | | Daily Target 2 | 639.69 | | Daily Target 3 | 645.60666666667 | | Daily Target 4 | 649.33 | | Daily Target 5 | 655.25 |
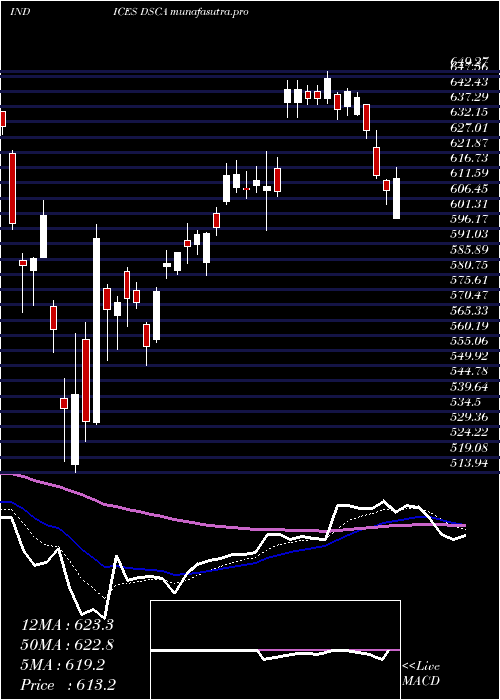
Daily price and volume Dj Us
| Date |
Closing |
Open |
Range |
Volume |
Mon 20 October 2025 |
643.42 (0.52%) |
645.76 |
641.88 - 651.52 |
0.8271 times |
Fri 17 October 2025 |
640.06 (-0.05%) |
639.89 |
637.83 - 644.44 |
0.7384 times |
Thu 16 October 2025 |
640.35 (-0.68%) |
646.90 |
636.96 - 648.83 |
0.718 times |
Wed 15 October 2025 |
644.74 (0.7%) |
644.15 |
643.51 - 652.56 |
0.7702 times |
Tue 14 October 2025 |
640.28 (1.33%) |
626.42 |
626.31 - 644.94 |
0.8235 times |
Mon 13 October 2025 |
631.87 (0.2%) |
633.05 |
627.77 - 636.23 |
1.0506 times |
Fri 10 October 2025 |
630.63 (-3.38%) |
647.98 |
627.07 - 649.29 |
1.3231 times |
Thu 09 October 2025 |
652.68 (0.34%) |
649.44 |
645.98 - 653.44 |
1.1203 times |
Wed 08 October 2025 |
650.47 (1.76%) |
642.67 |
641.63 - 652.77 |
1.2859 times |
Tue 07 October 2025 |
639.22 (-3.32%) |
656.56 |
632.83 - 656.56 |
1.3428 times |
Mon 06 October 2025 |
661.14 (-1.59%) |
673.72 |
659.44 - 675.55 |
0.9385 times |
Weekly price and charts DjUs Strong weekly Stock price targets for DjUs DSCA are 637.83 and 647.47 | Weekly Target 1 | 635.97 | | Weekly Target 2 | 639.69 | | Weekly Target 3 | 645.60666666667 | | Weekly Target 4 | 649.33 | | Weekly Target 5 | 655.25 |
Weekly price and volumes for Dj Us
| Date |
Closing |
Open |
Range |
Volume |
Mon 20 October 2025 |
643.42 (0.52%) |
645.76 |
641.88 - 651.52 |
0.2503 times |
Fri 17 October 2025 |
640.06 (1.5%) |
633.05 |
626.31 - 652.56 |
1.241 times |
Fri 10 October 2025 |
630.63 (-6.13%) |
673.72 |
627.07 - 675.55 |
1.819 times |
Fri 03 October 2025 |
671.80 (-7.25%) |
731.92 |
669.92 - 736.26 |
1.41 times |
Fri 26 September 2025 |
724.30 (-0.76%) |
724.65 |
712.26 - 735.95 |
1.0418 times |
Fri 19 September 2025 |
729.83 (0.92%) |
722.05 |
708.78 - 732.27 |
1.4814 times |
Fri 12 September 2025 |
723.15 (-3.68%) |
752.98 |
722.89 - 752.98 |
0.9648 times |
Fri 05 September 2025 |
750.80 (-3.99%) |
756.11 |
745.05 - 768.29 |
0.7935 times |
Fri 29 August 2025 |
781.99 (0%) |
782.00 |
775.95 - 784.81 |
0.1505 times |
Fri 29 August 2025 |
781.99 (2.94%) |
762.63 |
758.94 - 786.21 |
0.8476 times |
Fri 22 August 2025 |
759.63 (3.31%) |
739.97 |
732.06 - 760.44 |
0.9128 times |

Monthly price and charts DjUs Strong monthly Stock price targets for DjUs DSCA are 603.17 and 666.57 | Monthly Target 1 | 589.75 | | Monthly Target 2 | 616.58 | | Monthly Target 3 | 653.14666666667 | | Monthly Target 4 | 679.98 | | Monthly Target 5 | 716.55 |
Monthly price and volumes Dj Us
| Date |
Closing |
Open |
Range |
Volume |
Mon 20 October 2025 |
643.42 (-5.77%) |
682.45 |
626.31 - 689.71 |
0.9055 times |
Tue 30 September 2025 |
682.80 (-12.68%) |
756.11 |
678.94 - 768.29 |
1.1172 times |
Fri 29 August 2025 |
781.99 (4.26%) |
738.29 |
705.09 - 786.21 |
0.932 times |
Thu 31 July 2025 |
750.05 (7.24%) |
704.92 |
701.88 - 765.64 |
0.9471 times |
Mon 30 June 2025 |
699.40 (10.66%) |
619.02 |
605.34 - 700.76 |
0.9647 times |
Fri 30 May 2025 |
632.03 (6.33%) |
601.27 |
593.76 - 649.27 |
1.1732 times |
Wed 30 April 2025 |
594.42 (1.82%) |
581.87 |
513.94 - 605.61 |
1.1559 times |
Mon 31 March 2025 |
583.79 (-18.5%) |
723.52 |
567.96 - 727.15 |
0.9162 times |
Fri 28 February 2025 |
716.28 (3.35%) |
678.60 |
675.27 - 765.09 |
1.0414 times |
Fri 31 January 2025 |
693.03 (-5.43%) |
681.89 |
656.14 - 710.54 |
0.8468 times |
Tue 26 November 2024 |
732.79 (8.81%) |
677.11 |
659.57 - 741.17 |
0.8774 times |

DMA SMA EMA moving averages of Dj Us DSCA
DMA (daily moving average) of Dj Us DSCA
| DMA period | DMA value | | 5 day DMA | 641.77 | | 12 day DMA | 645.56 | | 20 day DMA | 672.97 | | 35 day DMA | 702.1 | | 50 day DMA | 716.13 | | 100 day DMA | 704.09 | | 150 day DMA | 672.2 | | 200 day DMA | 678.8 | EMA (exponential moving average) of Dj Us DSCA
| EMA period | EMA current | EMA prev | EMA prev2 | | 5 day EMA | 642.15 | 641.51 | 642.24 | | 12 day EMA | 652.46 | 654.1 | 656.65 | | 20 day EMA | 667.34 | 669.86 | 672.99 | | 35 day EMA | 688.44 | 691.09 | 694.09 | | 50 day EMA | 710.25 | 712.98 | 715.95 |
SMA (simple moving average) of Dj Us DSCA
| SMA period | SMA current | SMA prev | SMA prev2 | | 5 day SMA | 641.77 | 639.46 | 637.57 | | 12 day SMA | 645.56 | 648.41 | 651.97 | | 20 day SMA | 672.97 | 677.29 | 681.67 | | 35 day SMA | 702.1 | 706.06 | 710.18 | | 50 day SMA | 716.13 | 717.37 | 719.33 | | 100 day SMA | 704.09 | 703.8 | 703.69 | | 150 day SMA | 672.2 | 672.47 | 672.84 | | 200 day SMA | 678.8 | 679.15 | 679.52 |
|
|
