DjUs DSBT full analysis,charts,indicators,moving averages,SMA,DMA,EMA,ADX,MACD,RSIDj Us DSBT WideScreen charts, DMA,SMA,EMA technical analysis, forecast prediction, by indicators ADX,MACD,RSI,CCI INDICES stock exchange
Daily price and charts and targets DjUs Strong Daily Stock price targets for DjUs DSBT are 3027.57 and 3077.69 | Daily Target 1 | 2990.75 | | Daily Target 2 | 3014.27 | | Daily Target 3 | 3040.8733333333 | | Daily Target 4 | 3064.39 | | Daily Target 5 | 3090.99 |
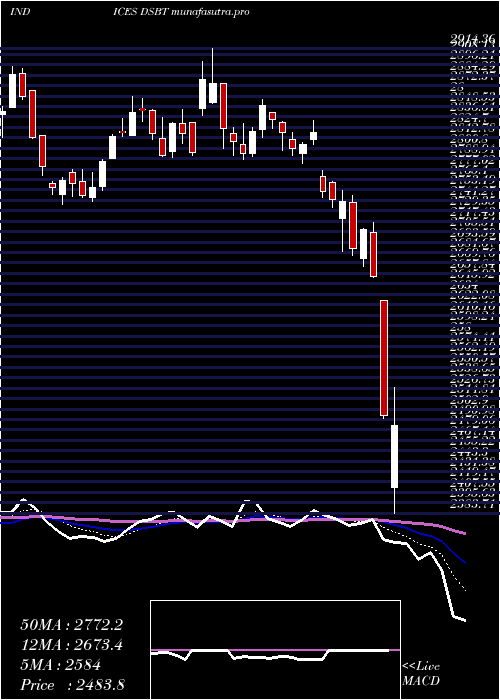
Daily price and volume Dj Us
| Date |
Closing |
Open |
Range |
Volume |
Tue 21 October 2025 |
3037.78 (0.89%) |
3020.00 |
3017.36 - 3067.48 |
1.0165 times |
Mon 20 October 2025 |
3011.09 (0.99%) |
2990.03 |
2987.15 - 3021.42 |
1.1848 times |
Fri 17 October 2025 |
2981.56 (0.93%) |
2948.09 |
2948.09 - 2986.49 |
1.0993 times |
Thu 16 October 2025 |
2953.98 (0.64%) |
2942.84 |
2942.84 - 2979.77 |
1.1286 times |
Wed 15 October 2025 |
2935.13 (0.03%) |
2935.79 |
2919.21 - 2955.89 |
0.9542 times |
Tue 14 October 2025 |
2934.22 (0.16%) |
2915.57 |
2909.87 - 2953.00 |
0.8716 times |
Mon 13 October 2025 |
2929.62 (0.54%) |
2909.46 |
2906.11 - 2949.13 |
0.9037 times |
Fri 10 October 2025 |
2913.85 (-1.02%) |
2950.28 |
2909.52 - 2959.76 |
1.0076 times |
Thu 09 October 2025 |
2943.94 (-0.28%) |
2953.86 |
2938.50 - 2964.02 |
0.8255 times |
Wed 08 October 2025 |
2952.29 (-0.11%) |
2953.38 |
2943.56 - 2972.44 |
1.0081 times |
Tue 07 October 2025 |
2955.47 (0.15%) |
2950.96 |
2939.45 - 2961.85 |
0.912 times |
Weekly price and charts DjUs Strong weekly Stock price targets for DjUs DSBT are 3012.47 and 3092.8 | Weekly Target 1 | 2950.47 | | Weekly Target 2 | 2994.13 | | Weekly Target 3 | 3030.8033333333 | | Weekly Target 4 | 3074.46 | | Weekly Target 5 | 3111.13 |
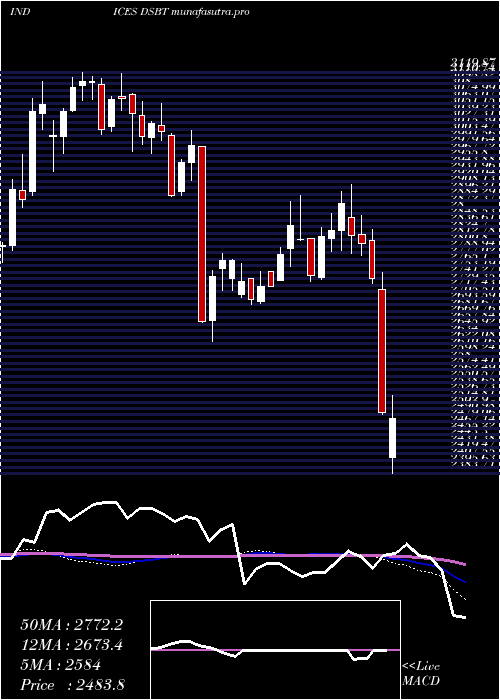
Weekly price and volumes for Dj Us
| Date |
Closing |
Open |
Range |
Volume |
Tue 21 October 2025 |
3037.78 (1.89%) |
2990.03 |
2987.15 - 3067.48 |
0.4713 times |
Fri 17 October 2025 |
2981.56 (2.32%) |
2909.46 |
2906.11 - 2986.49 |
1.0614 times |
Fri 10 October 2025 |
2913.85 (-1.96%) |
2967.57 |
2909.52 - 2972.44 |
1.0154 times |
Fri 03 October 2025 |
2972.15 (8.63%) |
2740.55 |
2722.43 - 3000.31 |
1.0639 times |
Fri 26 September 2025 |
2735.97 (-2.38%) |
2799.71 |
2703.40 - 2813.68 |
1.0437 times |
Fri 19 September 2025 |
2802.77 (1.29%) |
2763.13 |
2735.86 - 2818.26 |
1.4834 times |
Fri 12 September 2025 |
2767.21 (-0.8%) |
2768.54 |
2738.76 - 2823.65 |
1.2769 times |
Fri 05 September 2025 |
2789.57 (1.06%) |
2762.41 |
2739.72 - 2804.65 |
1.1592 times |
Fri 29 August 2025 |
2760.27 (0%) |
2745.61 |
2743.44 - 2761.08 |
0.2227 times |
Fri 29 August 2025 |
2760.27 (-1.09%) |
2787.81 |
2731.28 - 2792.95 |
1.2021 times |
Fri 22 August 2025 |
2790.72 (0.84%) |
2768.91 |
2752.33 - 2808.17 |
1.0343 times |
Monthly price and charts DjUs Strong monthly Stock price targets for DjUs DSBT are 2936.11 and 3169.15 | Monthly Target 1 | 2746.86 | | Monthly Target 2 | 2892.32 | | Monthly Target 3 | 2979.9 | | Monthly Target 4 | 3125.36 | | Monthly Target 5 | 3212.94 |
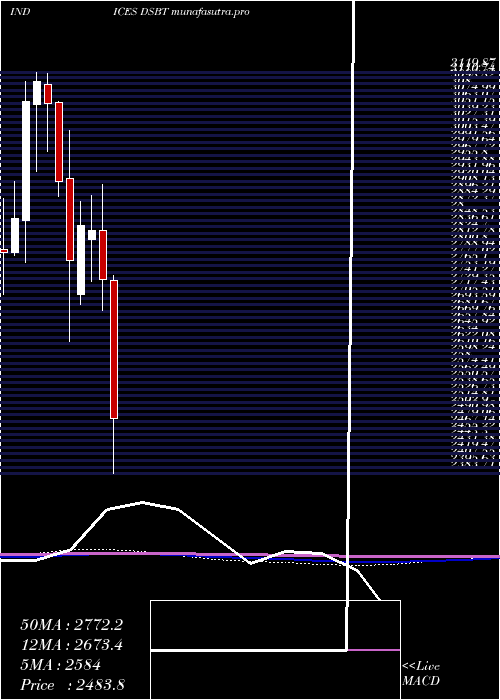
Monthly price and volumes Dj Us
| Date |
Closing |
Open |
Range |
Volume |
Tue 21 October 2025 |
3037.78 (7.43%) |
2834.44 |
2834.44 - 3067.48 |
0.6396 times |
Tue 30 September 2025 |
2827.62 (2.44%) |
2762.41 |
2703.40 - 2838.35 |
1.1073 times |
Fri 29 August 2025 |
2760.27 (4.48%) |
2632.71 |
2591.36 - 2808.17 |
1.0818 times |
Thu 31 July 2025 |
2641.81 (3.83%) |
2540.00 |
2530.54 - 2723.04 |
1.1364 times |
Mon 30 June 2025 |
2544.44 (1.8%) |
2497.23 |
2468.87 - 2608.57 |
1.0968 times |
Fri 30 May 2025 |
2499.41 (-3.32%) |
2566.74 |
2384.90 - 2598.33 |
1.3283 times |
Wed 30 April 2025 |
2585.30 (-5.63%) |
2738.40 |
2297.40 - 2747.36 |
1.0849 times |
Mon 31 March 2025 |
2739.62 (-3.18%) |
2829.52 |
2682.43 - 2914.36 |
0.8247 times |
Fri 28 February 2025 |
2829.61 (-0.35%) |
2812.29 |
2736.17 - 2894.04 |
0.8708 times |
Fri 31 January 2025 |
2839.55 (2.33%) |
2713.00 |
2694.59 - 2882.21 |
0.8293 times |
Tue 26 November 2024 |
2774.89 (-4.98%) |
2925.97 |
2626.83 - 3013.96 |
0.9228 times |
DMA SMA EMA moving averages of Dj Us DSBT
DMA (daily moving average) of Dj Us DSBT
| DMA period | DMA value | | 5 day DMA | 2983.91 | | 12 day DMA | 2958.33 | | 20 day DMA | 2900.55 | | 35 day DMA | 2847.62 | | 50 day DMA | 2819.47 | | 100 day DMA | 2702.98 | | 150 day DMA | 2665.4 | | 200 day DMA | 2693.32 | EMA (exponential moving average) of Dj Us DSBT
| EMA period | EMA current | EMA prev | EMA prev2 | | 5 day EMA | 2994.41 | 2972.73 | 2953.55 | | 12 day EMA | 2953.78 | 2938.51 | 2925.32 | | 20 day EMA | 2917.66 | 2905.02 | 2893.86 | | 35 day EMA | 2868.45 | 2858.48 | 2849.5 | | 50 day EMA | 2821.07 | 2812.23 | 2804.12 |
SMA (simple moving average) of Dj Us DSBT
| SMA period | SMA current | SMA prev | SMA prev2 | | 5 day SMA | 2983.91 | 2963.2 | 2946.9 | | 12 day SMA | 2958.33 | 2952.86 | 2949.89 | | 20 day SMA | 2900.55 | 2888.41 | 2877.99 | | 35 day SMA | 2847.62 | 2839.69 | 2832.52 | | 50 day SMA | 2819.47 | 2811.68 | 2804.39 | | 100 day SMA | 2702.98 | 2697.26 | 2691.81 | | 150 day SMA | 2665.4 | 2664.35 | 2662.92 | | 200 day SMA | 2693.32 | 2691.45 | 2690.27 |
|
|
