DjUs DSBC full analysis,charts,indicators,moving averages,SMA,DMA,EMA,ADX,MACD,RSIDj Us DSBC WideScreen charts, DMA,SMA,EMA technical analysis, forecast prediction, by indicators ADX,MACD,RSI,CCI INDICES stock exchange
Daily price and charts and targets DjUs Strong Daily Stock price targets for DjUs DSBC are 1148.7 and 1164.48 | Daily Target 1 | 1136.64 | | Daily Target 2 | 1144.97 | | Daily Target 3 | 1152.42 | | Daily Target 4 | 1160.75 | | Daily Target 5 | 1168.2 |
Daily price and volume Dj Us
| Date |
Closing |
Open |
Range |
Volume |
Fri 05 December 2025 |
1153.30 (1.01%) |
1144.70 |
1144.09 - 1159.87 |
2.4473 times |
Thu 04 December 2025 |
1141.79 (0.04%) |
1139.80 |
1130.96 - 1143.55 |
0.9246 times |
Wed 03 December 2025 |
1141.30 (0.82%) |
1128.64 |
1127.08 - 1143.07 |
0.7326 times |
Tue 02 December 2025 |
1132.00 (-0.19%) |
1135.97 |
1123.22 - 1137.49 |
0.9937 times |
Mon 01 December 2025 |
1134.19 (0.55%) |
1124.51 |
1124.16 - 1139.94 |
0.8015 times |
Fri 28 November 2025 |
1127.97 (0.7%) |
1119.00 |
1117.51 - 1131.43 |
0.4097 times |
Wed 26 November 2025 |
1120.10 (0.59%) |
1115.49 |
1115.49 - 1124.69 |
0.7694 times |
Tue 25 November 2025 |
1113.52 (1.15%) |
1106.97 |
1106.97 - 1118.75 |
0.7757 times |
Mon 24 November 2025 |
1100.89 (-2.26%) |
1122.19 |
1100.46 - 1122.56 |
1.2932 times |
Fri 21 November 2025 |
1126.33 (1.81%) |
1113.57 |
1111.92 - 1132.66 |
0.8523 times |
Thu 20 November 2025 |
1106.28 (-1.25%) |
1126.74 |
1105.19 - 1134.37 |
0.9312 times |
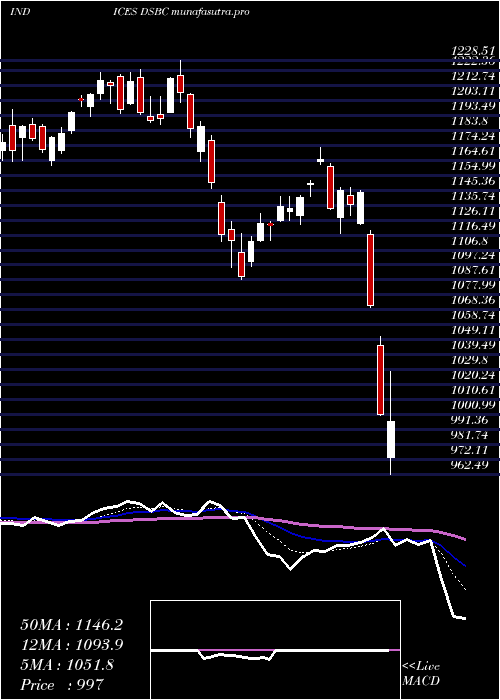
Weekly price and charts DjUs Strong weekly Stock price targets for DjUs DSBC are 1138.26 and 1174.91 | Weekly Target 1 | 1108.81 | | Weekly Target 2 | 1131.06 | | Weekly Target 3 | 1145.4633333333 | | Weekly Target 4 | 1167.71 | | Weekly Target 5 | 1182.11 |
Weekly price and volumes for Dj Us
| Date |
Closing |
Open |
Range |
Volume |
Fri 05 December 2025 |
1153.30 (2.25%) |
1124.51 |
1123.22 - 1159.87 |
1.5607 times |
Fri 28 November 2025 |
1127.97 (0.15%) |
1122.19 |
1100.46 - 1131.43 |
0.8592 times |
Fri 21 November 2025 |
1126.33 (-1.2%) |
1138.14 |
1105.19 - 1149.65 |
1.2141 times |
Fri 14 November 2025 |
1139.97 (-2.42%) |
1170.85 |
1134.99 - 1198.97 |
1.2735 times |
Fri 07 November 2025 |
1168.23 (-1.6%) |
1166.74 |
1158.05 - 1184.34 |
1.0169 times |
Fri 31 October 2025 |
1187.20 (0%) |
1162.91 |
1158.58 - 1189.56 |
0.3141 times |
Fri 31 October 2025 |
1187.20 (0.29%) |
1187.09 |
1144.91 - 1193.62 |
1.1825 times |
Fri 24 October 2025 |
1183.74 (1.33%) |
1171.89 |
1166.92 - 1206.36 |
0.9129 times |
Fri 17 October 2025 |
1168.15 (1.04%) |
1170.21 |
1152.51 - 1192.76 |
0.7303 times |
Fri 10 October 2025 |
1156.16 (-4.78%) |
1214.90 |
1155.68 - 1221.83 |
0.9357 times |
Fri 03 October 2025 |
1214.16 (-1.02%) |
1229.16 |
1207.05 - 1237.36 |
0.9246 times |
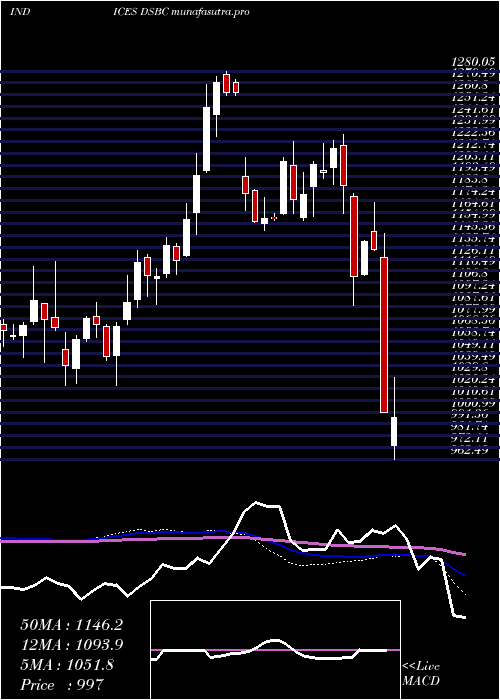
Monthly price and charts DjUs Strong monthly Stock price targets for DjUs DSBC are 1138.26 and 1174.91 | Monthly Target 1 | 1108.81 | | Monthly Target 2 | 1131.06 | | Monthly Target 3 | 1145.4633333333 | | Monthly Target 4 | 1167.71 | | Monthly Target 5 | 1182.11 |
Monthly price and volumes Dj Us
| Date |
Closing |
Open |
Range |
Volume |
Fri 05 December 2025 |
1153.30 (2.25%) |
1124.51 |
1123.22 - 1159.87 |
0.3365 times |
Fri 28 November 2025 |
1127.97 (-4.99%) |
1166.74 |
1100.46 - 1198.97 |
0.941 times |
Fri 31 October 2025 |
1187.20 (-3.64%) |
1225.43 |
1144.91 - 1233.75 |
0.9636 times |
Tue 30 September 2025 |
1231.99 (1.25%) |
1203.13 |
1188.50 - 1248.34 |
1.4534 times |
Fri 29 August 2025 |
1216.81 (0.94%) |
1194.57 |
1132.18 - 1233.76 |
1.1835 times |
Thu 31 July 2025 |
1205.45 (-5.92%) |
1273.09 |
1202.74 - 1294.88 |
1.1738 times |
Mon 30 June 2025 |
1281.36 (7.38%) |
1186.93 |
1179.03 - 1283.65 |
1.0078 times |
Fri 30 May 2025 |
1193.30 (10.96%) |
1074.98 |
1061.95 - 1216.32 |
1.0626 times |
Wed 30 April 2025 |
1075.40 (-6.08%) |
1141.87 |
962.49 - 1146.78 |
0.9567 times |
Mon 31 March 2025 |
1145.06 (-5.89%) |
1218.90 |
1087.92 - 1228.51 |
0.9209 times |
Fri 28 February 2025 |
1216.75 (3.52%) |
1160.67 |
1158.15 - 1223.02 |
0.918 times |
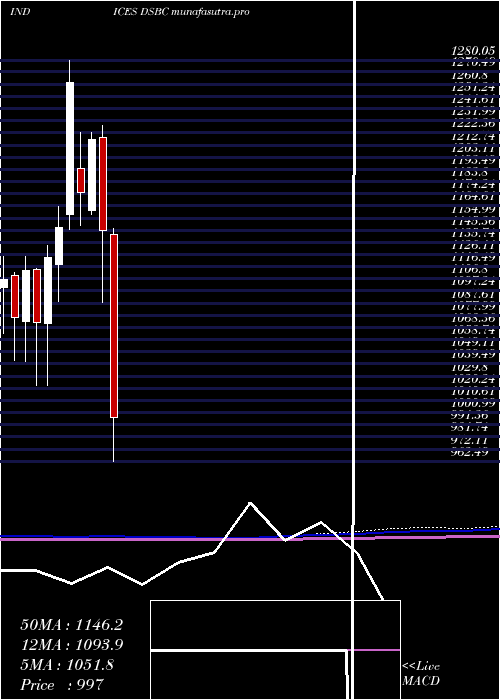
DMA SMA EMA moving averages of Dj Us DSBC
DMA (daily moving average) of Dj Us DSBC
| DMA period | DMA value | | 5 day DMA | 1140.52 | | 12 day DMA | 1126.5 | | 20 day DMA | 1140.26 | | 35 day DMA | 1157.87 | | 50 day DMA | 1170.36 | | 100 day DMA | 1193.03 | | 150 day DMA | 1197.26 | | 200 day DMA | 1178.76 | EMA (exponential moving average) of Dj Us DSBC
| EMA period | EMA current | EMA prev | EMA prev2 | | 5 day EMA | 1141.38 | 1135.42 | 1132.24 | | 12 day EMA | 1137.32 | 1134.42 | 1133.08 | | 20 day EMA | 1142.52 | 1141.39 | 1141.35 | | 35 day EMA | 1155.46 | 1155.59 | 1156.4 | | 50 day EMA | 1171.68 | 1172.43 | 1173.68 |
SMA (simple moving average) of Dj Us DSBC
| SMA period | SMA current | SMA prev | SMA prev2 | | 5 day SMA | 1140.52 | 1135.45 | 1131.11 | | 12 day SMA | 1126.5 | 1125.31 | 1124.46 | | 20 day SMA | 1140.26 | 1140.8 | 1142.48 | | 35 day SMA | 1157.87 | 1158.12 | 1159.31 | | 50 day SMA | 1170.36 | 1171.76 | 1173.31 | | 100 day SMA | 1193.03 | 1194.02 | 1195.28 | | 150 day SMA | 1197.26 | 1196.75 | 1196.29 | | 200 day SMA | 1178.76 | 1178.93 | 1179.07 |
|
|
