DjUs DSAT full analysis,charts,indicators,moving averages,SMA,DMA,EMA,ADX,MACD,RSIDj Us DSAT WideScreen charts, DMA,SMA,EMA technical analysis, forecast prediction, by indicators ADX,MACD,RSI,CCI INDICES stock exchange
Daily price and charts and targets DjUs Strong Daily Stock price targets for DjUs DSAT are 427.27 and 436.99 | Daily Target 1 | 419.58 | | Daily Target 2 | 425.24 | | Daily Target 3 | 429.3 | | Daily Target 4 | 434.96 | | Daily Target 5 | 439.02 |
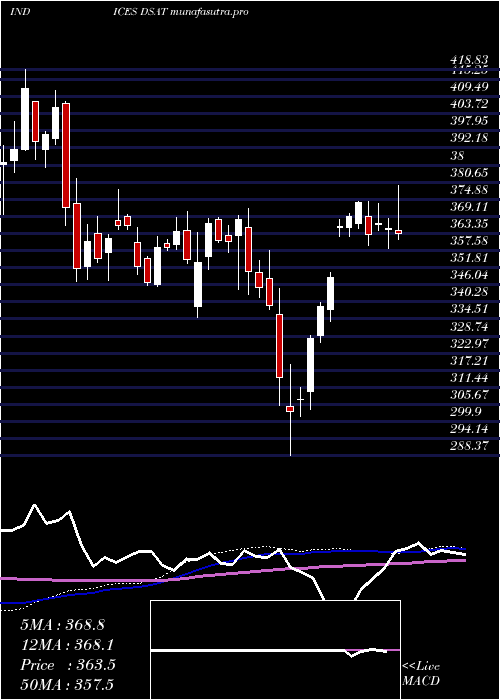
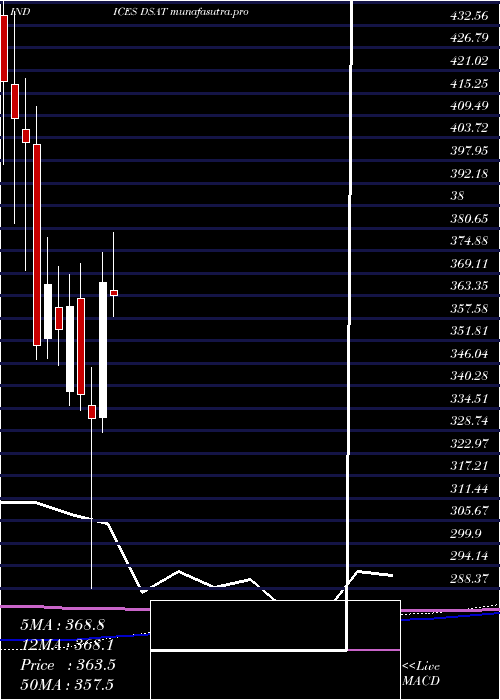
Daily price and volume Dj Us
| Date |
Closing |
Open |
Range |
Volume |
Tue 21 October 2025 |
430.90 (1.96%) |
424.73 |
423.64 - 433.36 |
1.0205 times |
Mon 20 October 2025 |
422.60 (0.3%) |
423.16 |
420.09 - 423.88 |
1.3441 times |
Fri 17 October 2025 |
421.34 (-1.01%) |
422.16 |
420.26 - 426.57 |
1.0109 times |
Thu 16 October 2025 |
425.66 (0.07%) |
426.26 |
421.82 - 426.75 |
0.9512 times |
Wed 15 October 2025 |
425.38 (0.7%) |
423.55 |
422.64 - 428.36 |
0.795 times |
Tue 14 October 2025 |
422.44 (1.34%) |
414.32 |
411.52 - 423.85 |
0.9204 times |
Mon 13 October 2025 |
416.84 (1.17%) |
415.03 |
414.74 - 418.33 |
1.0034 times |
Fri 10 October 2025 |
412.00 (-2%) |
422.67 |
411.66 - 424.70 |
0.9544 times |
Thu 09 October 2025 |
420.40 (-2.13%) |
429.19 |
418.65 - 429.19 |
1.1215 times |
Wed 08 October 2025 |
429.54 (-0.29%) |
432.88 |
428.57 - 433.88 |
0.8785 times |
Tue 07 October 2025 |
430.81 (-2.79%) |
441.73 |
429.19 - 441.73 |
1.0927 times |

Weekly price and charts DjUs Strong weekly Stock price targets for DjUs DSAT are 425.5 and 438.77 | Weekly Target 1 | 414.85 | | Weekly Target 2 | 422.87 | | Weekly Target 3 | 428.11666666667 | | Weekly Target 4 | 436.14 | | Weekly Target 5 | 441.39 |
Weekly price and volumes for Dj Us
| Date |
Closing |
Open |
Range |
Volume |
Tue 21 October 2025 |
430.90 (2.27%) |
423.16 |
420.09 - 433.36 |
0.6138 times |
Fri 17 October 2025 |
421.34 (2.27%) |
415.03 |
411.52 - 428.36 |
1.215 times |
Fri 10 October 2025 |
412.00 (-7.6%) |
447.24 |
411.66 - 447.77 |
1.2809 times |
Fri 03 October 2025 |
445.88 (1.42%) |
441.21 |
435.07 - 446.46 |
0.9607 times |
Fri 26 September 2025 |
439.65 (-0.22%) |
443.03 |
430.99 - 443.88 |
1.0525 times |
Fri 19 September 2025 |
440.64 (0.47%) |
440.60 |
432.90 - 446.61 |
1.4762 times |
Fri 12 September 2025 |
438.60 (0.46%) |
436.28 |
431.98 - 444.90 |
1.2012 times |
Fri 05 September 2025 |
436.61 (1.17%) |
426.73 |
424.95 - 442.09 |
0.9748 times |
Fri 29 August 2025 |
431.55 (0%) |
433.58 |
429.34 - 434.89 |
0.1864 times |
Fri 29 August 2025 |
431.55 (0.21%) |
429.28 |
428.44 - 436.52 |
1.0386 times |
Fri 22 August 2025 |
430.64 (3.74%) |
415.43 |
412.44 - 430.90 |
0.9571 times |
Monthly price and charts DjUs Strong monthly Stock price targets for DjUs DSAT are 403.09 and 439.34 | Monthly Target 1 | 393.81 | | Monthly Target 2 | 412.36 | | Monthly Target 3 | 430.06333333333 | | Monthly Target 4 | 448.61 | | Monthly Target 5 | 466.31 |
Monthly price and volumes Dj Us
| Date |
Closing |
Open |
Range |
Volume |
Tue 21 October 2025 |
430.90 (-1.79%) |
438.60 |
411.52 - 447.77 |
0.6849 times |
Tue 30 September 2025 |
438.76 (1.67%) |
426.73 |
424.95 - 446.61 |
0.9738 times |
Fri 29 August 2025 |
431.55 (11.59%) |
385.46 |
376.21 - 436.52 |
0.8748 times |
Thu 31 July 2025 |
386.72 (3.97%) |
371.65 |
369.85 - 402.05 |
1.3792 times |
Mon 30 June 2025 |
371.96 (1.45%) |
364.66 |
357.90 - 379.41 |
0.84 times |
Fri 30 May 2025 |
366.64 (10.45%) |
332.25 |
328.41 - 374.29 |
0.9324 times |
Wed 30 April 2025 |
331.96 (-1.76%) |
335.31 |
288.37 - 344.92 |
0.9884 times |
Mon 31 March 2025 |
337.92 (-6.3%) |
362.58 |
334.02 - 371.71 |
1.1007 times |
Fri 28 February 2025 |
360.63 (1.69%) |
338.71 |
335.18 - 368.87 |
0.9793 times |
Fri 31 January 2025 |
354.62 (-3.16%) |
360.40 |
345.33 - 370.69 |
1.2466 times |
Tue 26 November 2024 |
366.18 (4.45%) |
352.27 |
347.36 - 378.35 |
1.1243 times |
DMA SMA EMA moving averages of Dj Us DSAT
DMA (daily moving average) of Dj Us DSAT
| DMA period | DMA value | | 5 day DMA | 425.18 | | 12 day DMA | 425.09 | | 20 day DMA | 430.74 | | 35 day DMA | 433.63 | | 50 day DMA | 430.57 | | 100 day DMA | 404.84 | | 150 day DMA | 383.67 | | 200 day DMA | 377.47 | EMA (exponential moving average) of Dj Us DSAT
| EMA period | EMA current | EMA prev | EMA prev2 | | 5 day EMA | 425.59 | 422.93 | 423.09 | | 12 day EMA | 426.56 | 425.77 | 426.35 | | 20 day EMA | 428.27 | 427.99 | 428.56 | | 35 day EMA | 427.42 | 427.22 | 427.49 | | 50 day EMA | 426.69 | 426.52 | 426.68 |
SMA (simple moving average) of Dj Us DSAT
| SMA period | SMA current | SMA prev | SMA prev2 | | 5 day SMA | 425.18 | 423.48 | 422.33 | | 12 day SMA | 425.09 | 426.34 | 427.8 | | 20 day SMA | 430.74 | 431.15 | 432.05 | | 35 day SMA | 433.63 | 433.65 | 433.91 | | 50 day SMA | 430.57 | 429.76 | 429.13 | | 100 day SMA | 404.84 | 404.19 | 403.62 | | 150 day SMA | 383.67 | 383.25 | 382.75 | | 200 day SMA | 377.47 | 377.09 | 376.77 |
|
|
