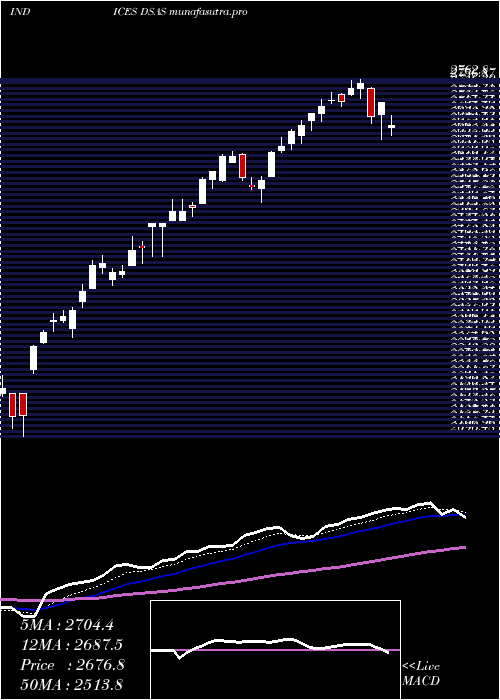
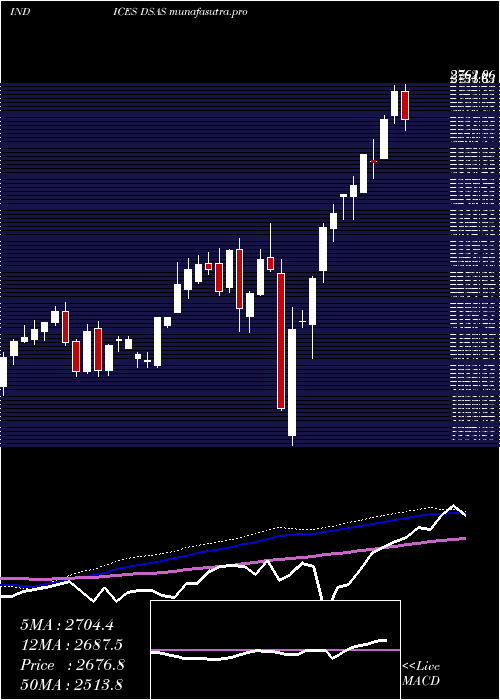
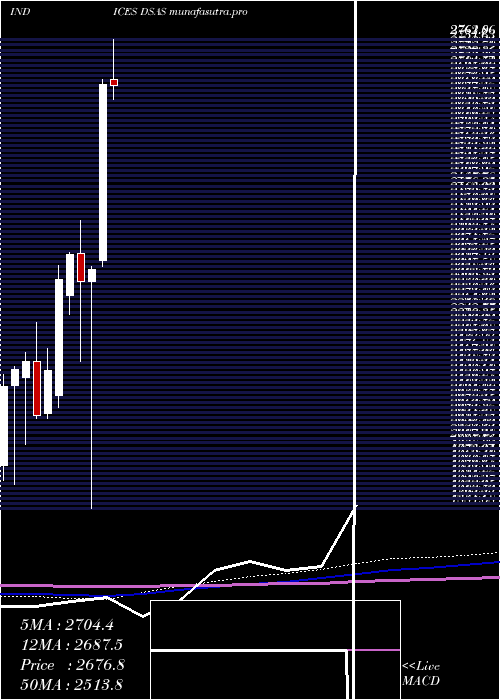
DjUs DSAS full analysis,charts,indicators,moving averages,SMA,DMA,EMA,ADX,MACD,RSIDj Us DSAS WideScreen charts, DMA,SMA,EMA technical analysis, forecast prediction, by indicators ADX,MACD,RSI,CCI INDICES stock exchange
Daily price and charts and targets DjUs Strong Daily Stock price targets for DjUs DSAS are 3034.33 and 3078.11 | Daily Target 1 | 2998.32 | | Daily Target 2 | 3026.55 | | Daily Target 3 | 3042.1033333333 | | Daily Target 4 | 3070.33 | | Daily Target 5 | 3085.88 |
Daily price and volume Dj Us
| Date |
Closing |
Open |
Range |
Volume |
Thu 04 December 2025 |
3054.77 (1.34%) |
3017.55 |
3013.88 - 3057.66 |
1.3023 times |
Wed 03 December 2025 |
3014.34 (-0.38%) |
3023.94 |
2993.54 - 3023.94 |
1.0065 times |
Tue 02 December 2025 |
3025.74 (1.55%) |
3025.55 |
3010.20 - 3032.76 |
1.1552 times |
Mon 01 December 2025 |
2979.56 (-2.71%) |
3054.58 |
2978.28 - 3054.58 |
0.8141 times |
Fri 28 November 2025 |
3062.56 (0.68%) |
3045.48 |
3039.24 - 3064.42 |
0.3514 times |
Wed 26 November 2025 |
3041.97 (0.92%) |
3022.81 |
3022.81 - 3058.76 |
0.7539 times |
Tue 25 November 2025 |
3014.14 (0.68%) |
3001.11 |
2950.42 - 3021.89 |
0.9092 times |
Mon 24 November 2025 |
2993.79 (1.47%) |
2950.83 |
2941.34 - 2997.17 |
1.3256 times |
Fri 21 November 2025 |
2950.34 (-0.56%) |
2966.10 |
2915.73 - 2969.66 |
1.1421 times |
Thu 20 November 2025 |
2966.97 (-2.4%) |
3089.06 |
2963.96 - 3094.17 |
1.2398 times |
Wed 19 November 2025 |
3040.02 (0.13%) |
3028.54 |
3012.31 - 3050.92 |
0.9661 times |
Weekly price and charts DjUs Strong weekly Stock price targets for DjUs DSAS are 3016.53 and 3095.91 | Weekly Target 1 | 2950.86 | | Weekly Target 2 | 3002.81 | | Weekly Target 3 | 3030.2366666667 | | Weekly Target 4 | 3082.19 | | Weekly Target 5 | 3109.62 |
Weekly price and volumes for Dj Us
| Date |
Closing |
Open |
Range |
Volume |
Thu 04 December 2025 |
3054.77 (-0.25%) |
3054.58 |
2978.28 - 3057.66 |
0.9516 times |
Fri 28 November 2025 |
3062.56 (3.8%) |
2950.83 |
2941.34 - 3064.42 |
0.7429 times |
Fri 21 November 2025 |
2950.34 (-4.47%) |
3095.90 |
2915.73 - 3104.81 |
1.1506 times |
Fri 14 November 2025 |
3088.36 (-0.78%) |
3119.16 |
3028.95 - 3155.70 |
1.1681 times |
Fri 07 November 2025 |
3112.69 (-1.49%) |
3113.01 |
3041.52 - 3140.98 |
0.871 times |
Fri 31 October 2025 |
3159.71 (0%) |
3158.66 |
3137.43 - 3177.27 |
0.2135 times |
Fri 31 October 2025 |
3159.71 (-0.85%) |
3200.50 |
3137.43 - 3261.93 |
1.1561 times |
Fri 24 October 2025 |
3186.71 (5.56%) |
3039.81 |
3039.81 - 3214.26 |
1.1801 times |
Fri 17 October 2025 |
3018.81 (1.51%) |
2987.40 |
2987.28 - 3084.33 |
1.1232 times |
Fri 10 October 2025 |
2974.02 (-2.49%) |
3056.63 |
2973.99 - 3129.85 |
1.4428 times |
Fri 03 October 2025 |
3050.10 (0.66%) |
3034.74 |
2990.70 - 3074.58 |
0.9897 times |
Monthly price and charts DjUs Strong monthly Stock price targets for DjUs DSAS are 3016.53 and 3095.91 | Monthly Target 1 | 2950.86 | | Monthly Target 2 | 3002.81 | | Monthly Target 3 | 3030.2366666667 | | Monthly Target 4 | 3082.19 | | Monthly Target 5 | 3109.62 |
Monthly price and volumes Dj Us
| Date |
Closing |
Open |
Range |
Volume |
Thu 04 December 2025 |
3054.77 (-0.25%) |
3054.58 |
2978.28 - 3057.66 |
0.302 times |
Fri 28 November 2025 |
3062.56 (-3.07%) |
3113.01 |
2915.73 - 3155.70 |
1.2482 times |
Fri 31 October 2025 |
3159.71 (3.1%) |
3059.43 |
2973.99 - 3261.93 |
1.7925 times |
Tue 30 September 2025 |
3064.58 (3.65%) |
2918.15 |
2884.01 - 3070.99 |
1.1147 times |
Fri 29 August 2025 |
2956.53 (0.1%) |
2938.13 |
2854.30 - 2982.38 |
0.7626 times |
Thu 31 July 2025 |
2953.61 (4.72%) |
2806.11 |
2741.90 - 3039.19 |
0.9039 times |
Mon 30 June 2025 |
2820.52 (5.36%) |
2686.47 |
2648.03 - 2825.30 |
1.0622 times |
Fri 30 May 2025 |
2677.12 (14.79%) |
2349.14 |
2337.53 - 2686.12 |
1.0593 times |
Wed 30 April 2025 |
2332.14 (0.96%) |
2309.34 |
1884.68 - 2338.03 |
0.9833 times |
Mon 31 March 2025 |
2310.03 (-2.07%) |
2361.11 |
2160.12 - 2423.40 |
0.7712 times |
Fri 28 February 2025 |
2358.91 (1.98%) |
2283.90 |
2248.30 - 2362.85 |
0.6829 times |
DMA SMA EMA moving averages of Dj Us DSAS
DMA (daily moving average) of Dj Us DSAS
| DMA period | DMA value | | 5 day DMA | 3027.39 | | 12 day DMA | 3015.01 | | 20 day DMA | 3051.04 | | 35 day DMA | 3087.2 | | 50 day DMA | 3073.99 | | 100 day DMA | 3008.52 | | 150 day DMA | 2884.44 | | 200 day DMA | 2729 | EMA (exponential moving average) of Dj Us DSAS
| EMA period | EMA current | EMA prev | EMA prev2 | | 5 day EMA | 3029.61 | 3017.03 | 3018.38 | | 12 day EMA | 3032.86 | 3028.88 | 3031.52 | | 20 day EMA | 3045.77 | 3044.82 | 3048.03 | | 35 day EMA | 3051.88 | 3051.71 | 3053.91 | | 50 day EMA | 3063.44 | 3063.79 | 3065.81 |
SMA (simple moving average) of Dj Us DSAS
| SMA period | SMA current | SMA prev | SMA prev2 | | 5 day SMA | 3027.39 | 3024.83 | 3024.79 | | 12 day SMA | 3015.01 | 3015.23 | 3021.4 | | 20 day SMA | 3051.04 | 3053.25 | 3057.73 | | 35 day SMA | 3087.2 | 3086.31 | 3087.33 | | 50 day SMA | 3073.99 | 3073.8 | 3073.72 | | 100 day SMA | 3008.52 | 3006.33 | 3004.5 | | 150 day SMA | 2884.44 | 2879.55 | 2874.87 | | 200 day SMA | 2729 | 2725.33 | 2721.72 |
|
|
