DjUs DSAM full analysis,charts,indicators,moving averages,SMA,DMA,EMA,ADX,MACD,RSIDj Us DSAM WideScreen charts, DMA,SMA,EMA technical analysis, forecast prediction, by indicators ADX,MACD,RSI,CCI INDICES stock exchange
Daily price and charts and targets DjUs Strong Daily Stock price targets for DjUs DSAM are 3024.32 and 3048.87 | Daily Target 1 | 3017.86 | | Daily Target 2 | 3030.77 | | Daily Target 3 | 3042.41 | | Daily Target 4 | 3055.32 | | Daily Target 5 | 3066.96 |
Daily price and volume Dj Us
| Date |
Closing |
Open |
Range |
Volume |
Thu 04 December 2025 |
3043.68 (-0.06%) |
3046.06 |
3029.50 - 3054.05 |
0.886 times |
Wed 03 December 2025 |
3045.46 (-0.07%) |
3052.74 |
3036.58 - 3065.39 |
0.8276 times |
Tue 02 December 2025 |
3047.69 (-0.78%) |
3078.96 |
3044.01 - 3080.03 |
0.8909 times |
Mon 01 December 2025 |
3071.80 (-1.09%) |
3097.13 |
3069.77 - 3101.97 |
0.9019 times |
Fri 28 November 2025 |
3105.78 (0.07%) |
3100.13 |
3093.31 - 3110.34 |
0.3905 times |
Wed 26 November 2025 |
3103.48 (-0.31%) |
3108.50 |
3100.94 - 3122.04 |
0.7713 times |
Tue 25 November 2025 |
3113.16 (1.72%) |
3067.83 |
3067.83 - 3117.79 |
1.1261 times |
Mon 24 November 2025 |
3060.37 (0.82%) |
3034.52 |
3028.74 - 3077.44 |
1.6516 times |
Fri 21 November 2025 |
3035.48 (2.31%) |
2972.89 |
2971.77 - 3050.75 |
1.3936 times |
Thu 20 November 2025 |
2966.97 (-1.32%) |
2993.84 |
2966.07 - 3024.73 |
1.1605 times |
Wed 19 November 2025 |
3006.64 (0.1%) |
3001.89 |
2987.64 - 3028.71 |
1.3272 times |
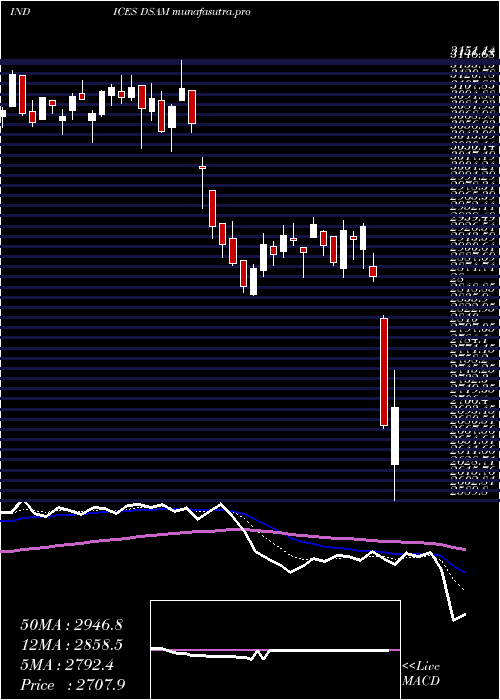
Weekly price and charts DjUs Strong weekly Stock price targets for DjUs DSAM are 3000.36 and 3072.83 | Weekly Target 1 | 2985.91 | | Weekly Target 2 | 3014.8 | | Weekly Target 3 | 3058.3833333333 | | Weekly Target 4 | 3087.27 | | Weekly Target 5 | 3130.85 |
Weekly price and volumes for Dj Us
| Date |
Closing |
Open |
Range |
Volume |
Thu 04 December 2025 |
3043.68 (-2%) |
3097.13 |
3029.50 - 3101.97 |
0.7808 times |
Fri 28 November 2025 |
3105.78 (2.32%) |
3034.52 |
3028.74 - 3122.04 |
0.8772 times |
Fri 21 November 2025 |
3035.48 (0.59%) |
3007.60 |
2966.07 - 3050.75 |
1.4048 times |
Fri 14 November 2025 |
3017.78 (1.78%) |
2959.40 |
2949.03 - 3071.56 |
1.1901 times |
Fri 07 November 2025 |
2965.13 (2.09%) |
2933.32 |
2893.63 - 2966.73 |
1.118 times |
Fri 31 October 2025 |
2904.29 (0%) |
2912.85 |
2895.82 - 2925.70 |
0.3466 times |
Fri 31 October 2025 |
2904.29 (-3.04%) |
2999.67 |
2895.82 - 3023.56 |
1.3125 times |
Fri 24 October 2025 |
2995.24 (3.48%) |
2904.53 |
2904.53 - 3045.52 |
1.1426 times |
Fri 17 October 2025 |
2894.63 (1.41%) |
2856.37 |
2835.49 - 2898.75 |
0.9263 times |
Fri 10 October 2025 |
2854.36 (-2.75%) |
2938.95 |
2853.03 - 2945.91 |
0.901 times |
Fri 03 October 2025 |
2935.20 (1.51%) |
2885.28 |
2813.52 - 2955.54 |
0.9603 times |
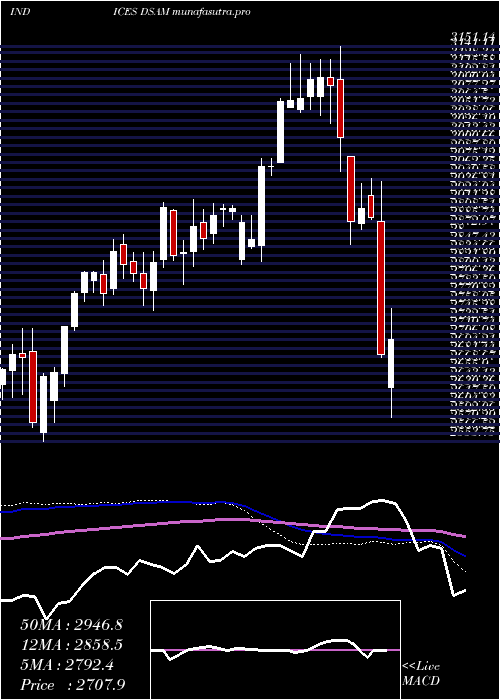
Monthly price and charts DjUs Strong monthly Stock price targets for DjUs DSAM are 3000.36 and 3072.83 | Monthly Target 1 | 2985.91 | | Monthly Target 2 | 3014.8 | | Monthly Target 3 | 3058.3833333333 | | Monthly Target 4 | 3087.27 | | Monthly Target 5 | 3130.85 |
Monthly price and volumes Dj Us
| Date |
Closing |
Open |
Range |
Volume |
Thu 04 December 2025 |
3043.68 (-2%) |
3097.13 |
3029.50 - 3101.97 |
0.1907 times |
Fri 28 November 2025 |
3105.78 (6.94%) |
2933.32 |
2893.63 - 3122.04 |
1.1211 times |
Fri 31 October 2025 |
2904.29 (-0.23%) |
2913.06 |
2813.52 - 3045.52 |
1.2594 times |
Tue 30 September 2025 |
2911.10 (-3%) |
2983.61 |
2842.31 - 3035.57 |
1.1512 times |
Fri 29 August 2025 |
3001.27 (3.14%) |
2900.84 |
2872.35 - 3036.03 |
1.0137 times |
Thu 31 July 2025 |
2910.04 (-4.01%) |
3023.17 |
2904.99 - 3041.00 |
1.0168 times |
Mon 30 June 2025 |
3031.49 (1.56%) |
2974.42 |
2890.41 - 3035.63 |
0.9236 times |
Fri 30 May 2025 |
2985.01 (2.52%) |
2897.53 |
2863.76 - 3047.14 |
1.2772 times |
Wed 30 April 2025 |
2911.56 (-0.77%) |
2926.89 |
2589.86 - 2943.52 |
1.1112 times |
Mon 31 March 2025 |
2934.08 (-5.09%) |
3099.90 |
2850.82 - 3151.14 |
0.9352 times |
Fri 28 February 2025 |
3091.47 (0.72%) |
3055.74 |
3034.77 - 3137.91 |
0.9109 times |
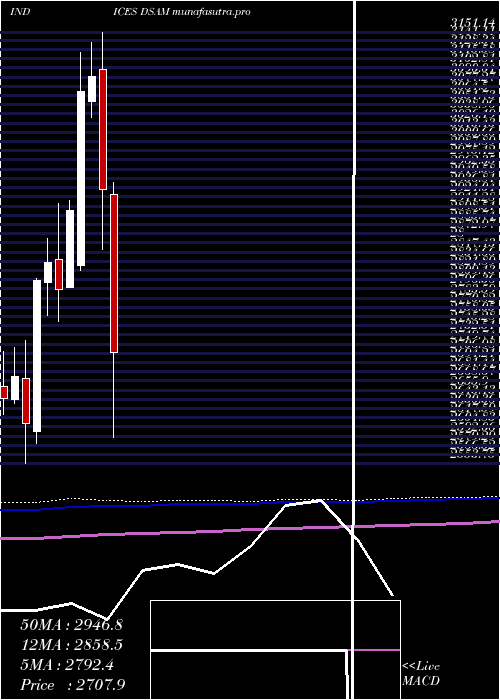
DMA SMA EMA moving averages of Dj Us DSAM
DMA (daily moving average) of Dj Us DSAM
| DMA period | DMA value | | 5 day DMA | 3062.88 | | 12 day DMA | 3050.33 | | 20 day DMA | 3031.67 | | 35 day DMA | 2995.19 | | 50 day DMA | 2964.85 | | 100 day DMA | 2965.54 | | 150 day DMA | 2967.47 | | 200 day DMA | 2961.53 | EMA (exponential moving average) of Dj Us DSAM
| EMA period | EMA current | EMA prev | EMA prev2 | | 5 day EMA | 3055.13 | 3060.86 | 3068.56 | | 12 day EMA | 3048.61 | 3049.51 | 3050.25 | | 20 day EMA | 3031.66 | 3030.39 | 3028.8 | | 35 day EMA | 3002.74 | 3000.33 | 2997.67 | | 50 day EMA | 2971.01 | 2968.04 | 2964.88 |
SMA (simple moving average) of Dj Us DSAM
| SMA period | SMA current | SMA prev | SMA prev2 | | 5 day SMA | 3062.88 | 3074.84 | 3088.38 | | 12 day SMA | 3050.33 | 3046.24 | 3043.94 | | 20 day SMA | 3031.67 | 3025.9 | 3020.85 | | 35 day SMA | 2995.19 | 2990.15 | 2985.56 | | 50 day SMA | 2964.85 | 2962.47 | 2960.08 | | 100 day SMA | 2965.54 | 2965.12 | 2964.53 | | 150 day SMA | 2967.47 | 2966.55 | 2965.5 | | 200 day SMA | 2961.53 | 2961.98 | 2962.19 |
|
|
