DjUs DSAI full analysis,charts,indicators,moving averages,SMA,DMA,EMA,ADX,MACD,RSIDj Us DSAI WideScreen charts, DMA,SMA,EMA technical analysis, forecast prediction, by indicators ADX,MACD,RSI,CCI INDICES stock exchange
Daily price and charts and targets DjUs Strong Daily Stock price targets for DjUs DSAI are 1733.31 and 1753.73 | Daily Target 1 | 1717.18 | | Daily Target 2 | 1729.01 | | Daily Target 3 | 1737.6 | | Daily Target 4 | 1749.43 | | Daily Target 5 | 1758.02 |
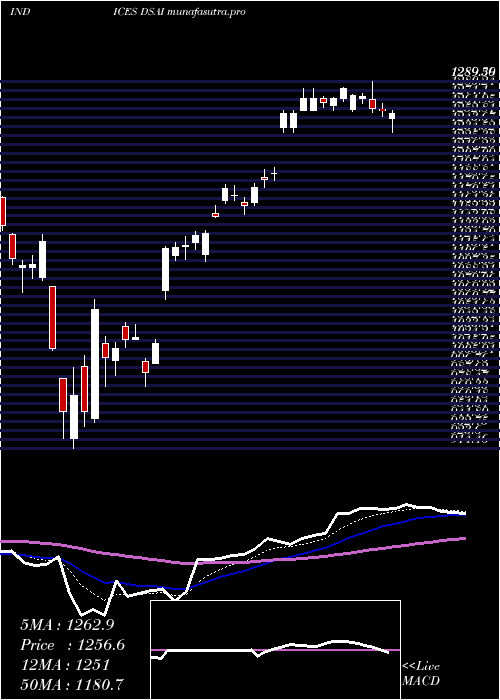
Daily price and volume Dj Us
| Date |
Closing |
Open |
Range |
Volume |
Mon 20 October 2025 |
1740.84 (1.63%) |
1725.77 |
1725.77 - 1746.19 |
0.892 times |
Fri 17 October 2025 |
1712.90 (-1.11%) |
1717.86 |
1698.22 - 1730.00 |
0.9215 times |
Thu 16 October 2025 |
1732.10 (0.74%) |
1731.05 |
1722.00 - 1743.11 |
1.0652 times |
Wed 15 October 2025 |
1719.30 (1.69%) |
1725.35 |
1699.29 - 1734.41 |
1.2514 times |
Tue 14 October 2025 |
1690.67 (-0.44%) |
1676.80 |
1661.30 - 1711.57 |
0.9012 times |
Mon 13 October 2025 |
1698.15 (2.15%) |
1670.54 |
1670.54 - 1711.50 |
0.9435 times |
Fri 10 October 2025 |
1662.47 (-4.63%) |
1748.55 |
1660.57 - 1749.78 |
1.2822 times |
Thu 09 October 2025 |
1743.25 (-0.07%) |
1746.83 |
1726.27 - 1748.70 |
0.744 times |
Wed 08 October 2025 |
1744.40 (1.45%) |
1722.83 |
1721.04 - 1746.23 |
0.9391 times |
Tue 07 October 2025 |
1719.48 (-0.25%) |
1731.57 |
1702.98 - 1734.51 |
1.06 times |
Mon 06 October 2025 |
1723.77 (0.89%) |
1736.49 |
1715.62 - 1739.67 |
1.1133 times |
Weekly price and charts DjUs Strong weekly Stock price targets for DjUs DSAI are 1733.31 and 1753.73 | Weekly Target 1 | 1717.18 | | Weekly Target 2 | 1729.01 | | Weekly Target 3 | 1737.6 | | Weekly Target 4 | 1749.43 | | Weekly Target 5 | 1758.02 |
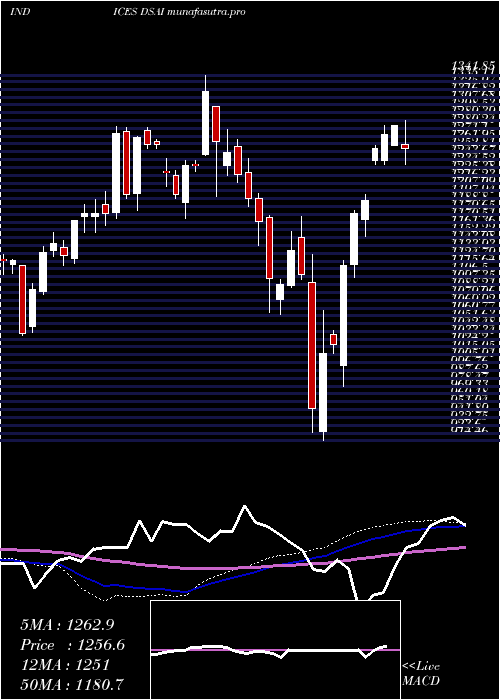
Weekly price and volumes for Dj Us
| Date |
Closing |
Open |
Range |
Volume |
Mon 20 October 2025 |
1740.84 (1.63%) |
1725.77 |
1725.77 - 1746.19 |
0.1796 times |
Fri 17 October 2025 |
1712.90 (3.03%) |
1670.54 |
1661.30 - 1743.11 |
1.0233 times |
Fri 10 October 2025 |
1662.47 (-2.7%) |
1736.49 |
1660.57 - 1749.78 |
1.0346 times |
Fri 03 October 2025 |
1708.53 (1.32%) |
1688.61 |
1675.29 - 1730.58 |
0.891 times |
Fri 26 September 2025 |
1686.21 (-1.18%) |
1697.79 |
1650.34 - 1723.97 |
1.2249 times |
Fri 19 September 2025 |
1706.31 (3.6%) |
1648.64 |
1629.70 - 1710.74 |
1.5807 times |
Fri 12 September 2025 |
1647.06 (4.78%) |
1577.65 |
1570.43 - 1664.70 |
1.6686 times |
Fri 05 September 2025 |
1571.86 (2.52%) |
1501.68 |
1499.62 - 1587.16 |
1.1127 times |
Fri 29 August 2025 |
1533.15 (0%) |
1561.43 |
1529.17 - 1562.96 |
0.2041 times |
Fri 29 August 2025 |
1533.15 (-0.69%) |
1543.12 |
1529.17 - 1572.14 |
1.0805 times |
Fri 22 August 2025 |
1543.78 (0.82%) |
1533.07 |
1474.69 - 1555.39 |
1.0899 times |
Monthly price and charts DjUs Strong monthly Stock price targets for DjUs DSAI are 1700.71 and 1789.92 | Monthly Target 1 | 1627.85 | | Monthly Target 2 | 1684.35 | | Monthly Target 3 | 1717.0633333333 | | Monthly Target 4 | 1773.56 | | Monthly Target 5 | 1806.27 |
Monthly price and volumes Dj Us
| Date |
Closing |
Open |
Range |
Volume |
Mon 20 October 2025 |
1740.84 (2%) |
1700.59 |
1660.57 - 1749.78 |
0.5875 times |
Tue 30 September 2025 |
1706.73 (11.32%) |
1501.68 |
1499.62 - 1723.97 |
1.3089 times |
Fri 29 August 2025 |
1533.15 (0.36%) |
1496.83 |
1470.18 - 1587.95 |
1.1023 times |
Thu 31 July 2025 |
1527.65 (10.06%) |
1384.92 |
1370.78 - 1549.48 |
1.0531 times |
Mon 30 June 2025 |
1388.06 (7.68%) |
1282.78 |
1273.56 - 1390.64 |
0.8631 times |
Fri 30 May 2025 |
1289.01 (13.65%) |
1155.01 |
1150.96 - 1298.06 |
1.1042 times |
Wed 30 April 2025 |
1134.24 (2.94%) |
1099.31 |
914.46 - 1136.89 |
1.1356 times |
Mon 31 March 2025 |
1101.80 (-5.92%) |
1175.44 |
1061.78 - 1177.98 |
0.9894 times |
Fri 28 February 2025 |
1171.07 (-7.43%) |
1237.05 |
1142.57 - 1279.07 |
0.9042 times |
Fri 31 January 2025 |
1265.00 (0.32%) |
1230.09 |
1174.59 - 1341.85 |
0.9518 times |
Tue 26 November 2024 |
1260.93 (7.98%) |
1174.17 |
1171.84 - 1281.81 |
0.7715 times |

DMA SMA EMA moving averages of Dj Us DSAI
DMA (daily moving average) of Dj Us DSAI
| DMA period | DMA value | | 5 day DMA | 1719.16 | | 12 day DMA | 1716.32 | | 20 day DMA | 1708.84 | | 35 day DMA | 1669.4 | | 50 day DMA | 1631.55 | | 100 day DMA | 1510.24 | | 150 day DMA | 1383.57 | | 200 day DMA | 1345.54 | EMA (exponential moving average) of Dj Us DSAI
| EMA period | EMA current | EMA prev | EMA prev2 | | 5 day EMA | 1723.11 | 1714.24 | 1714.91 | | 12 day EMA | 1713.49 | 1708.52 | 1707.72 | | 20 day EMA | 1700.33 | 1696.07 | 1694.3 | | 35 day EMA | 1667.28 | 1662.95 | 1660.01 | | 50 day EMA | 1631.94 | 1627.5 | 1624.02 |
SMA (simple moving average) of Dj Us DSAI
| SMA period | SMA current | SMA prev | SMA prev2 | | 5 day SMA | 1719.16 | 1710.62 | 1700.54 | | 12 day SMA | 1716.32 | 1714.09 | 1713.57 | | 20 day SMA | 1708.84 | 1707.12 | 1706.18 | | 35 day SMA | 1669.4 | 1663.46 | 1659.38 | | 50 day SMA | 1631.55 | 1627.85 | 1624.33 | | 100 day SMA | 1510.24 | 1505.46 | 1501.07 | | 150 day SMA | 1383.57 | 1379.35 | 1375.45 | | 200 day SMA | 1345.54 | 1342.99 | 1340.64 |
|
|
