DjUs DSAF full analysis,charts,indicators,moving averages,SMA,DMA,EMA,ADX,MACD,RSIDj Us DSAF WideScreen charts, DMA,SMA,EMA technical analysis, forecast prediction, by indicators ADX,MACD,RSI,CCI INDICES stock exchange
Daily price and charts and targets DjUs Strong Daily Stock price targets for DjUs DSAF are 1033.8 and 1044.6 | Daily Target 1 | 1025.97 | | Daily Target 2 | 1030.82 | | Daily Target 3 | 1036.77 | | Daily Target 4 | 1041.62 | | Daily Target 5 | 1047.57 |
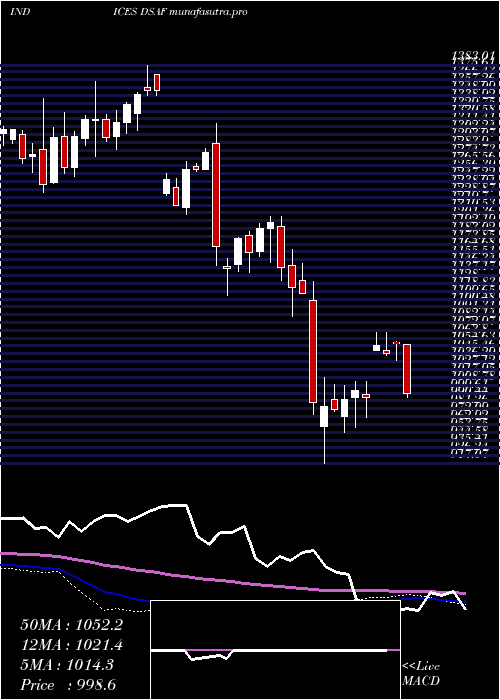
Daily price and volume Dj Us
| Date |
Closing |
Open |
Range |
Volume |
Mon 20 October 2025 |
1035.67 (0.55%) |
1032.43 |
1031.92 - 1042.72 |
0.8133 times |
Fri 17 October 2025 |
1030.02 (0.81%) |
1023.65 |
1020.79 - 1034.57 |
1.2555 times |
Thu 16 October 2025 |
1021.79 (0.9%) |
1019.71 |
1006.48 - 1026.08 |
1.0638 times |
Wed 15 October 2025 |
1012.71 (0.16%) |
1012.74 |
1002.84 - 1020.32 |
0.8344 times |
Tue 14 October 2025 |
1011.05 (1.9%) |
989.75 |
982.23 - 1012.68 |
1.0175 times |
Mon 13 October 2025 |
992.16 (1%) |
985.95 |
985.95 - 996.37 |
0.8991 times |
Fri 10 October 2025 |
982.31 (-3.69%) |
1021.25 |
981.32 - 1025.91 |
1.4274 times |
Thu 09 October 2025 |
1019.92 (-1.73%) |
1039.63 |
1017.62 - 1040.59 |
0.9812 times |
Wed 08 October 2025 |
1037.89 (-0.3%) |
1032.80 |
1026.85 - 1045.24 |
0.9119 times |
Tue 07 October 2025 |
1040.99 (-1.21%) |
1056.41 |
1040.62 - 1059.33 |
0.7958 times |
Mon 06 October 2025 |
1053.70 (0.32%) |
1049.98 |
1042.04 - 1058.64 |
1.0424 times |

Weekly price and charts DjUs Strong weekly Stock price targets for DjUs DSAF are 1033.8 and 1044.6 | Weekly Target 1 | 1025.97 | | Weekly Target 2 | 1030.82 | | Weekly Target 3 | 1036.77 | | Weekly Target 4 | 1041.62 | | Weekly Target 5 | 1047.57 |
Weekly price and volumes for Dj Us
| Date |
Closing |
Open |
Range |
Volume |
Mon 20 October 2025 |
1035.67 (0.55%) |
1032.43 |
1031.92 - 1042.72 |
0.1689 times |
Fri 17 October 2025 |
1030.02 (4.86%) |
985.95 |
982.23 - 1034.57 |
1.0528 times |
Fri 10 October 2025 |
982.31 (-6.48%) |
1049.98 |
981.32 - 1059.33 |
1.0712 times |
Fri 03 October 2025 |
1050.34 (2.9%) |
1022.59 |
1005.38 - 1057.95 |
0.9456 times |
Fri 26 September 2025 |
1020.70 (0.82%) |
1010.32 |
997.70 - 1028.44 |
1.3521 times |
Fri 19 September 2025 |
1012.35 (0.06%) |
1016.73 |
1003.44 - 1033.24 |
1.742 times |
Fri 12 September 2025 |
1011.75 (0.54%) |
1006.54 |
983.26 - 1017.38 |
1.2667 times |
Fri 05 September 2025 |
1006.28 (-1.8%) |
1011.55 |
990.53 - 1016.89 |
1.0538 times |
Fri 29 August 2025 |
1024.75 (0%) |
1025.46 |
1021.59 - 1035.99 |
0.2291 times |
Fri 29 August 2025 |
1024.75 (-1.3%) |
1034.20 |
1014.78 - 1036.80 |
1.1179 times |
Fri 22 August 2025 |
1038.21 (2.03%) |
1010.42 |
1000.82 - 1044.51 |
1.172 times |
Monthly price and charts DjUs Strong monthly Stock price targets for DjUs DSAF are 1008.5 and 1086.51 | Monthly Target 1 | 947.43 | | Monthly Target 2 | 991.55 | | Monthly Target 3 | 1025.44 | | Monthly Target 4 | 1069.56 | | Monthly Target 5 | 1103.45 |
Monthly price and volumes Dj Us
| Date |
Closing |
Open |
Range |
Volume |
Mon 20 October 2025 |
1035.67 (1.79%) |
1017.56 |
981.32 - 1059.33 |
0.5955 times |
Tue 30 September 2025 |
1017.46 (-0.71%) |
1011.55 |
983.26 - 1033.24 |
1.2958 times |
Fri 29 August 2025 |
1024.75 (3.47%) |
988.81 |
966.75 - 1044.51 |
1.1707 times |
Thu 31 July 2025 |
990.41 (-5.74%) |
1050.45 |
973.37 - 1112.96 |
1.0467 times |
Mon 30 June 2025 |
1050.72 (3.72%) |
1009.69 |
996.89 - 1063.83 |
0.8724 times |
Fri 30 May 2025 |
1013.03 (3.51%) |
976.76 |
968.22 - 1070.59 |
1.1267 times |
Wed 30 April 2025 |
978.70 (-12.79%) |
1121.89 |
917.07 - 1129.85 |
1.0202 times |
Mon 31 March 2025 |
1122.27 (-5.85%) |
1192.49 |
1089.14 - 1206.34 |
0.9286 times |
Fri 28 February 2025 |
1192.05 (1.78%) |
1148.04 |
1113.88 - 1197.76 |
0.9714 times |
Fri 31 January 2025 |
1171.25 (-13.49%) |
1232.78 |
1149.25 - 1315.00 |
0.972 times |
Tue 26 November 2024 |
1353.91 (4.12%) |
1300.58 |
1285.35 - 1383.01 |
0.6798 times |

DMA SMA EMA moving averages of Dj Us DSAF
DMA (daily moving average) of Dj Us DSAF
| DMA period | DMA value | | 5 day DMA | 1022.25 | | 12 day DMA | 1024.05 | | 20 day DMA | 1021.48 | | 35 day DMA | 1015.54 | | 50 day DMA | 1016.8 | | 100 day DMA | 1027.75 | | 150 day DMA | 1035.57 | | 200 day DMA | 1084.81 | EMA (exponential moving average) of Dj Us DSAF
| EMA period | EMA current | EMA prev | EMA prev2 | | 5 day EMA | 1024.81 | 1019.38 | 1014.06 | | 12 day EMA | 1021.28 | 1018.66 | 1016.59 | | 20 day EMA | 1019.9 | 1018.24 | 1017 | | 35 day EMA | 1018.07 | 1017.03 | 1016.27 | | 50 day EMA | 1015.44 | 1014.61 | 1013.98 |
SMA (simple moving average) of Dj Us DSAF
| SMA period | SMA current | SMA prev | SMA prev2 | | 5 day SMA | 1022.25 | 1013.55 | 1004 | | 12 day SMA | 1024.05 | 1023.29 | 1022.25 | | 20 day SMA | 1021.48 | 1020.31 | 1019.56 | | 35 day SMA | 1015.54 | 1015.23 | 1015.1 | | 50 day SMA | 1016.8 | 1016.13 | 1015.5 | | 100 day SMA | 1027.75 | 1027.43 | 1027.37 | | 150 day SMA | 1035.57 | 1036.36 | 1037.4 | | 200 day SMA | 1084.81 | 1086.28 | 1087.8 |
|
|
