DjUtility DJU full analysis,charts,indicators,moving averages,SMA,DMA,EMA,ADX,MACD,RSIDj Utility DJU WideScreen charts, DMA,SMA,EMA technical analysis, forecast prediction, by indicators ADX,MACD,RSI,CCI INDICES stock exchange
Daily price and charts and targets DjUtility Strong Daily Stock price targets for DjUtility DJU are 1071.67 and 1082.8 | Daily Target 1 | 1069.69 | | Daily Target 2 | 1073.64 | | Daily Target 3 | 1080.82 | | Daily Target 4 | 1084.77 | | Daily Target 5 | 1091.95 |
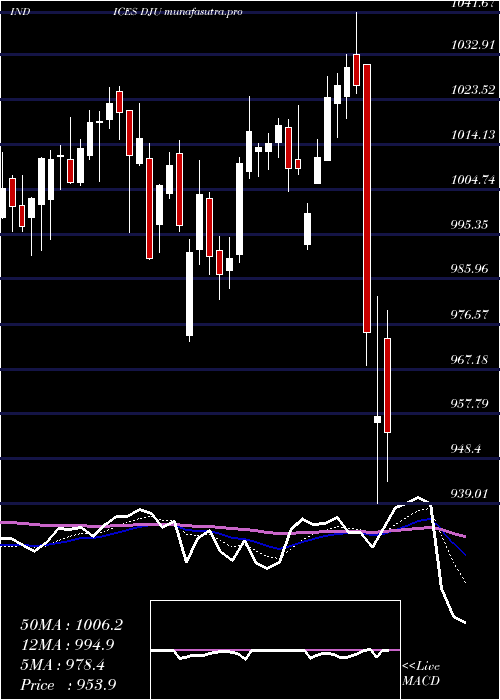
Daily price and volume Dj Utility
| Date |
Closing |
Open |
Range |
Volume |
Fri 05 December 2025 |
1077.59 (-0.92%) |
1086.44 |
1076.87 - 1088.00 |
0.9748 times |
Thu 04 December 2025 |
1087.60 (-0.18%) |
1086.08 |
1084.92 - 1096.18 |
1.1249 times |
Wed 03 December 2025 |
1089.61 (-0.35%) |
1095.77 |
1085.64 - 1098.28 |
1.0161 times |
Tue 02 December 2025 |
1093.41 (-0.78%) |
1106.20 |
1092.33 - 1106.22 |
0.9596 times |
Mon 01 December 2025 |
1102.06 (-2.33%) |
1123.52 |
1101.39 - 1123.52 |
1.0429 times |
Fri 28 November 2025 |
1128.32 (0.63%) |
1122.85 |
1121.80 - 1128.94 |
0.4118 times |
Wed 26 November 2025 |
1121.27 (1.34%) |
1108.76 |
1108.76 - 1122.65 |
0.6809 times |
Tue 25 November 2025 |
1106.46 (-0.65%) |
1115.69 |
1103.38 - 1117.68 |
0.8765 times |
Mon 24 November 2025 |
1113.65 (0.63%) |
1105.85 |
1098.38 - 1115.38 |
1.7156 times |
Fri 21 November 2025 |
1106.73 (0.23%) |
1106.57 |
1100.74 - 1112.57 |
1.1969 times |
Thu 20 November 2025 |
1104.18 (-0.23%) |
1108.97 |
1102.36 - 1120.51 |
1.0343 times |
Weekly price and charts DjUtility Strong weekly Stock price targets for DjUtility DJU are 1053.91 and 1100.56 | Weekly Target 1 | 1046.01 | | Weekly Target 2 | 1061.8 | | Weekly Target 3 | 1092.66 | | Weekly Target 4 | 1108.45 | | Weekly Target 5 | 1139.31 |
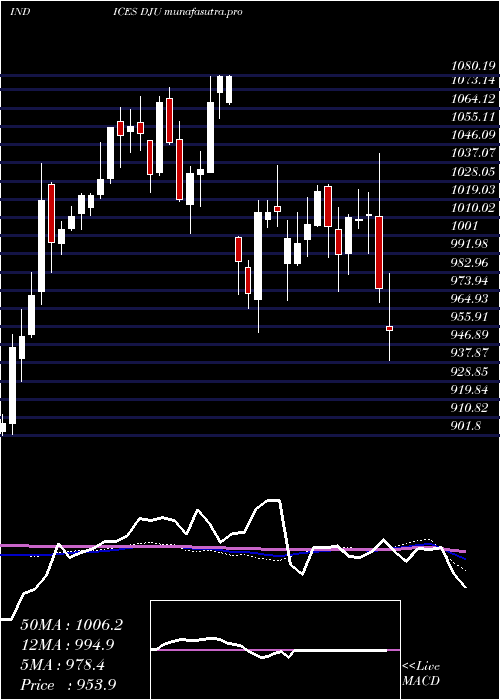
Weekly price and volumes for Dj Utility
| Date |
Closing |
Open |
Range |
Volume |
Fri 05 December 2025 |
1077.59 (-4.5%) |
1123.52 |
1076.87 - 1123.52 |
1.2279 times |
Fri 28 November 2025 |
1128.32 (1.95%) |
1105.85 |
1098.38 - 1128.94 |
0.884 times |
Fri 21 November 2025 |
1106.73 (-0.62%) |
1117.16 |
1100.74 - 1127.49 |
1.241 times |
Fri 14 November 2025 |
1113.61 (-1.22%) |
1127.94 |
1110.32 - 1129.83 |
1.0798 times |
Fri 07 November 2025 |
1127.39 (1.42%) |
1113.43 |
1106.51 - 1127.39 |
1.0215 times |
Fri 31 October 2025 |
1111.57 (0%) |
1115.15 |
1104.38 - 1117.06 |
0.2596 times |
Fri 31 October 2025 |
1111.57 (-3.1%) |
1143.01 |
1104.38 - 1145.93 |
1.2564 times |
Fri 24 October 2025 |
1147.18 (-0.52%) |
1157.89 |
1132.57 - 1162.72 |
0.8942 times |
Fri 17 October 2025 |
1153.13 (1.14%) |
1140.53 |
1139.25 - 1180.65 |
0.9931 times |
Fri 10 October 2025 |
1140.17 (1.38%) |
1127.38 |
1120.68 - 1153.49 |
1.1426 times |
Fri 03 October 2025 |
1124.60 (0.92%) |
1109.99 |
1103.04 - 1131.96 |
0.928 times |
Monthly price and charts DjUtility Strong monthly Stock price targets for DjUtility DJU are 1053.91 and 1100.56 | Monthly Target 1 | 1046.01 | | Monthly Target 2 | 1061.8 | | Monthly Target 3 | 1092.66 | | Monthly Target 4 | 1108.45 | | Monthly Target 5 | 1139.31 |
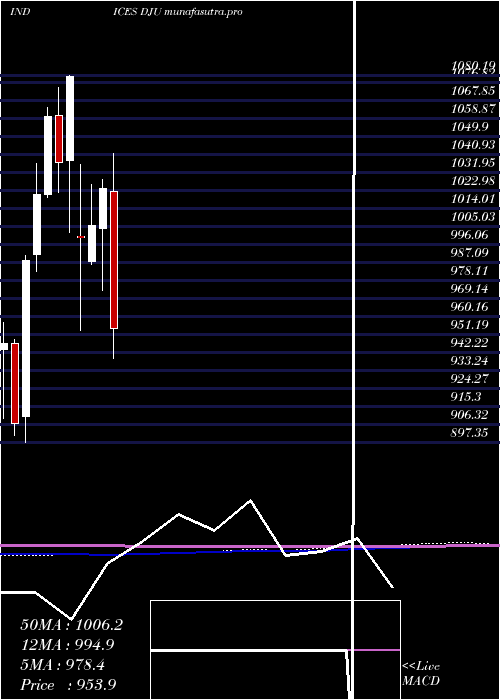
Monthly price and volumes Dj Utility
| Date |
Closing |
Open |
Range |
Volume |
Fri 05 December 2025 |
1077.59 (-4.5%) |
1123.52 |
1076.87 - 1123.52 |
0.3075 times |
Fri 28 November 2025 |
1128.32 (1.51%) |
1113.43 |
1098.38 - 1129.83 |
1.0583 times |
Fri 31 October 2025 |
1111.57 (-0.59%) |
1119.77 |
1104.38 - 1180.65 |
1.2499 times |
Tue 30 September 2025 |
1118.18 (2.7%) |
1080.50 |
1062.03 - 1118.95 |
1.1547 times |
Fri 29 August 2025 |
1088.74 (-1.12%) |
1099.16 |
1086.83 - 1128.68 |
1.0857 times |
Thu 31 July 2025 |
1101.03 (5.11%) |
1080.79 |
1069.35 - 1104.06 |
0.2344 times |
Fri 27 June 2025 |
1047.50 (0.64%) |
1037.02 |
1016.42 - 1055.45 |
1.053 times |
Fri 30 May 2025 |
1040.89 (0.78%) |
1039.54 |
988.62 - 1053.83 |
1.3575 times |
Wed 30 April 2025 |
1032.82 (0.86%) |
1022.57 |
928.75 - 1041.67 |
1.2823 times |
Mon 31 March 2025 |
1024.05 (1.85%) |
1003.92 |
973.06 - 1028.27 |
1.2167 times |
Fri 28 February 2025 |
1005.45 (0.59%) |
987.35 |
986.14 - 1026.17 |
1.2428 times |
DMA SMA EMA moving averages of Dj Utility DJU
DMA (daily moving average) of Dj Utility DJU
| DMA period | DMA value | | 5 day DMA | 1090.05 | | 12 day DMA | 1103.13 | | 20 day DMA | 1110 | | 35 day DMA | 1118.5 | | 50 day DMA | 1123.34 | | 100 day DMA | 1105.42 | | 150 day DMA | 1078.27 | | 200 day DMA | 1059.82 | EMA (exponential moving average) of Dj Utility DJU
| EMA period | EMA current | EMA prev | EMA prev2 | | 5 day EMA | 1090.14 | 1096.41 | 1100.82 | | 12 day EMA | 1100.51 | 1104.68 | 1107.79 | | 20 day EMA | 1106.43 | 1109.46 | 1111.76 | | 35 day EMA | 1112.9 | 1114.98 | 1116.59 | | 50 day EMA | 1117.61 | 1119.24 | 1120.53 |
SMA (simple moving average) of Dj Utility DJU
| SMA period | SMA current | SMA prev | SMA prev2 | | 5 day SMA | 1090.05 | 1100.2 | 1106.93 | | 12 day SMA | 1103.13 | 1106.43 | 1109.39 | | 20 day SMA | 1110 | 1111.77 | 1113.06 | | 35 day SMA | 1118.5 | 1120.81 | 1123.12 | | 50 day SMA | 1123.34 | 1123.89 | 1124.12 | | 100 day SMA | 1105.42 | 1105.02 | 1104.57 | | 150 day SMA | 1078.27 | 1077.83 | 1077.24 | | 200 day SMA | 1059.82 | 1059.29 | 1058.79 |
|
|
