DowJones DJC full analysis,charts,indicators,moving averages,SMA,DMA,EMA,ADX,MACD,RSIDow Jones DJC WideScreen charts, DMA,SMA,EMA technical analysis, forecast prediction, by indicators ADX,MACD,RSI,CCI INDICES stock exchange
Daily price and charts and targets DowJones Strong Daily Stock price targets for DowJones DJC are 14885.52 and 14966.15 | Daily Target 1 | 14825.86 | | Daily Target 2 | 14864.54 | | Daily Target 3 | 14906.49 | | Daily Target 4 | 14945.17 | | Daily Target 5 | 14987.12 |
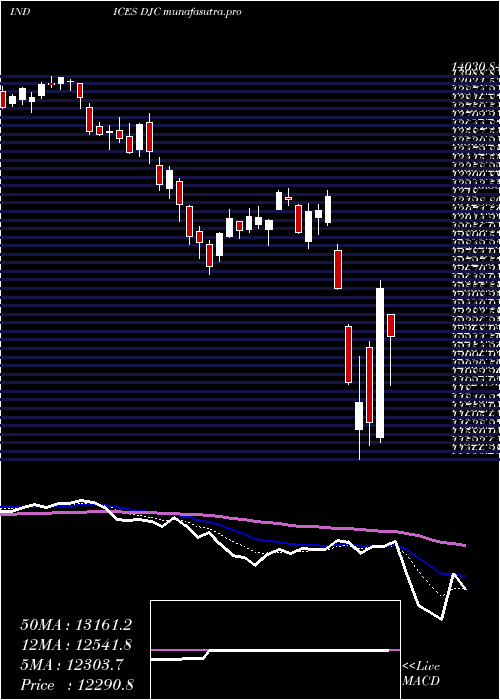
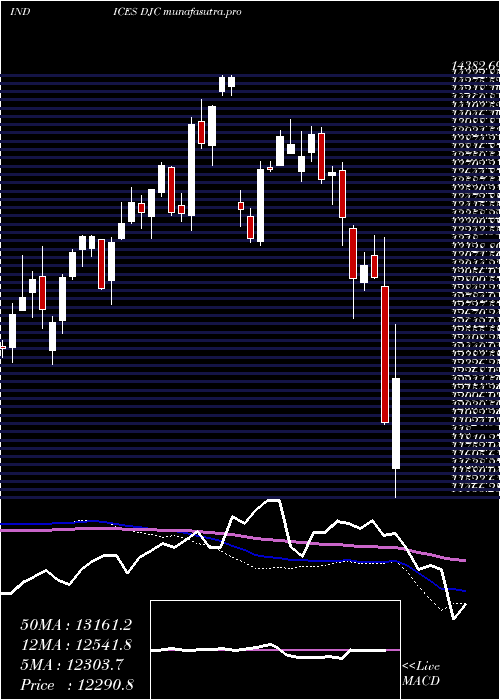
Daily price and volume Dow Jones
| Date |
Closing |
Open |
Range |
Volume |
Fri 05 December 2025 |
14903.22 (0.18%) |
14876.77 |
14867.81 - 14948.44 |
0.8829 times |
Thu 04 December 2025 |
14875.86 (-0.02%) |
14879.60 |
14837.90 - 14913.04 |
0.9639 times |
Wed 03 December 2025 |
14878.89 (0.96%) |
14739.85 |
14737.33 - 14896.07 |
0.9583 times |
Tue 02 December 2025 |
14736.83 (0.3%) |
14733.26 |
14675.22 - 14774.77 |
0.9734 times |
Mon 01 December 2025 |
14692.78 (-0.88%) |
14779.40 |
14687.28 - 14814.87 |
0.9407 times |
Fri 28 November 2025 |
14822.99 (0.55%) |
14758.22 |
14754.36 - 14842.24 |
0.4952 times |
Wed 26 November 2025 |
14741.65 (0.78%) |
14643.79 |
14643.79 - 14784.70 |
0.8548 times |
Tue 25 November 2025 |
14627.71 (1.34%) |
14451.27 |
14432.84 - 14647.47 |
1.1609 times |
Mon 24 November 2025 |
14433.58 (0.4%) |
14396.97 |
14318.19 - 14466.77 |
1.359 times |
Fri 21 November 2025 |
14376.17 (1.41%) |
14230.50 |
14198.70 - 14468.36 |
1.4109 times |
Thu 20 November 2025 |
14176.76 (-0.88%) |
14407.23 |
14172.08 - 14512.79 |
1.2902 times |
Weekly price and charts DowJones Strong weekly Stock price targets for DowJones DJC are 14789.22 and 15062.44 | Weekly Target 1 | 14569.07 | | Weekly Target 2 | 14736.15 | | Weekly Target 3 | 14842.293333333 | | Weekly Target 4 | 15009.37 | | Weekly Target 5 | 15115.51 |
Weekly price and volumes for Dow Jones
| Date |
Closing |
Open |
Range |
Volume |
Fri 05 December 2025 |
14903.22 (0.54%) |
14779.40 |
14675.22 - 14948.44 |
1.0897 times |
Fri 28 November 2025 |
14822.99 (3.11%) |
14396.97 |
14318.19 - 14842.24 |
0.8936 times |
Fri 21 November 2025 |
14376.17 (-1.42%) |
14556.76 |
14172.08 - 14604.07 |
1.3197 times |
Fri 14 November 2025 |
14583.12 (-0.11%) |
14645.05 |
14505.23 - 14940.69 |
1.0801 times |
Fri 07 November 2025 |
14599.65 (-0.2%) |
14490.76 |
14444.93 - 14677.98 |
0.9409 times |
Fri 31 October 2025 |
14629.25 (0%) |
14621.86 |
14563.15 - 14673.27 |
0.2837 times |
Fri 31 October 2025 |
14629.25 (0.67%) |
14610.44 |
14552.15 - 14751.68 |
1.2703 times |
Fri 24 October 2025 |
14531.28 (1.08%) |
14437.14 |
14353.54 - 14620.28 |
0.9669 times |
Fri 17 October 2025 |
14376.31 (2.02%) |
14151.41 |
14116.44 - 14497.58 |
1.0331 times |
Fri 10 October 2025 |
14091.98 (-2.66%) |
14488.77 |
14091.04 - 14538.19 |
1.122 times |
Fri 03 October 2025 |
14476.82 (1%) |
14371.87 |
14266.78 - 14571.83 |
0.9271 times |
Monthly price and charts DowJones Strong monthly Stock price targets for DowJones DJC are 14789.22 and 15062.44 | Monthly Target 1 | 14569.07 | | Monthly Target 2 | 14736.15 | | Monthly Target 3 | 14842.293333333 | | Monthly Target 4 | 15009.37 | | Monthly Target 5 | 15115.51 |
Monthly price and volumes Dow Jones
| Date |
Closing |
Open |
Range |
Volume |
Fri 05 December 2025 |
14903.22 (0.54%) |
14779.40 |
14675.22 - 14948.44 |
0.267 times |
Fri 28 November 2025 |
14822.99 (1.32%) |
14490.76 |
14172.08 - 14940.69 |
1.0377 times |
Fri 31 October 2025 |
14629.25 (1.82%) |
14357.74 |
14091.04 - 14751.68 |
1.2536 times |
Tue 30 September 2025 |
14368.38 (1.31%) |
14039.15 |
13996.49 - 14406.48 |
1.2076 times |
Fri 29 August 2025 |
14181.98 (2.58%) |
13747.75 |
13587.94 - 14309.93 |
1.1072 times |
Thu 31 July 2025 |
13824.82 (1.04%) |
14133.94 |
13800.09 - 14144.38 |
0.2364 times |
Fri 27 June 2025 |
13681.85 (3.66%) |
13174.10 |
13049.49 - 13731.40 |
1.0017 times |
Fri 30 May 2025 |
13198.15 (4.29%) |
12709.98 |
12659.82 - 13410.88 |
1.2673 times |
Wed 30 April 2025 |
12655.44 (-3.59%) |
13089.94 |
11466.28 - 13265.96 |
1.4136 times |
Mon 31 March 2025 |
13127.02 (-4.26%) |
13726.31 |
12709.62 - 13784.36 |
1.2079 times |
Fri 28 February 2025 |
13711.75 (-1.41%) |
13724.65 |
13498.22 - 14030.84 |
1.1006 times |

DMA SMA EMA moving averages of Dow Jones DJC
DMA (daily moving average) of Dow Jones DJC
| DMA period | DMA value | | 5 day DMA | 14817.52 | | 12 day DMA | 14630.73 | | 20 day DMA | 14624.77 | | 35 day DMA | 14591.56 | | 50 day DMA | 14520.57 | | 100 day DMA | 14245.63 | | 150 day DMA | 13794.86 | | 200 day DMA | 13746.22 | EMA (exponential moving average) of Dow Jones DJC
| EMA period | EMA current | EMA prev | EMA prev2 | | 5 day EMA | 14829.3 | 14792.35 | 14750.6 | | 12 day EMA | 14718.66 | 14685.12 | 14650.45 | | 20 day EMA | 14657.79 | 14631.97 | 14606.31 | | 35 day EMA | 14581.46 | 14562.52 | 14544.07 | | 50 day EMA | 14531.73 | 14516.57 | 14501.91 |
SMA (simple moving average) of Dow Jones DJC
| SMA period | SMA current | SMA prev | SMA prev2 | | 5 day SMA | 14817.52 | 14801.47 | 14774.63 | | 12 day SMA | 14630.73 | 14582.03 | 14544.92 | | 20 day SMA | 14624.77 | 14605.19 | 14592 | | 35 day SMA | 14591.56 | 14575.26 | 14561.07 | | 50 day SMA | 14520.57 | 14508.19 | 14496.94 | | 100 day SMA | 14245.63 | 14228.36 | 14213.48 | | 150 day SMA | 13794.86 | 13782.11 | 13770.99 | | 200 day SMA | 13746.22 | 13737.98 | 13730.9 |
|
|
