TsxvDeclining DECV full analysis,charts,indicators,moving averages,SMA,DMA,EMA,ADX,MACD,RSITsxv Declining DECV WideScreen charts, DMA,SMA,EMA technical analysis, forecast prediction, by indicators ADX,MACD,RSI,CCI INDICES stock exchange
Daily price and charts and targets TsxvDeclining Strong Daily Stock price targets for TsxvDeclining DECV are 268 and 440 | Daily Target 1 | 128 | | Daily Target 2 | 236 | | Daily Target 3 | 300 | | Daily Target 4 | 408 | | Daily Target 5 | 472 |
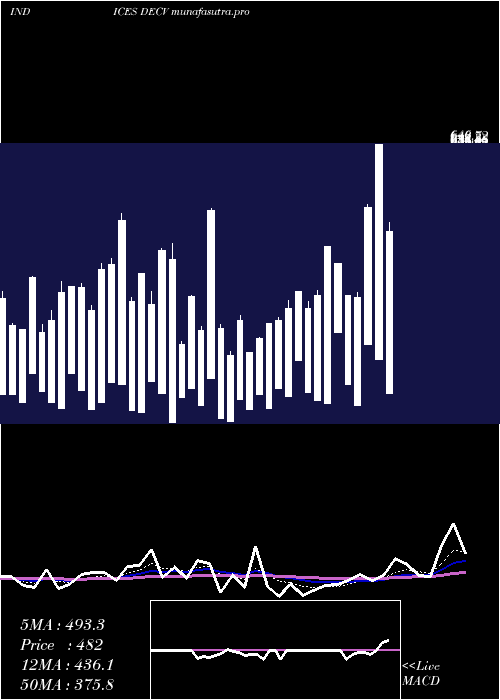
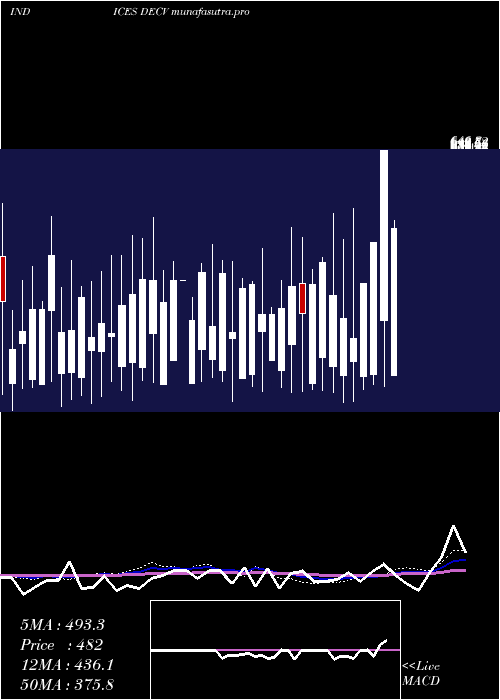
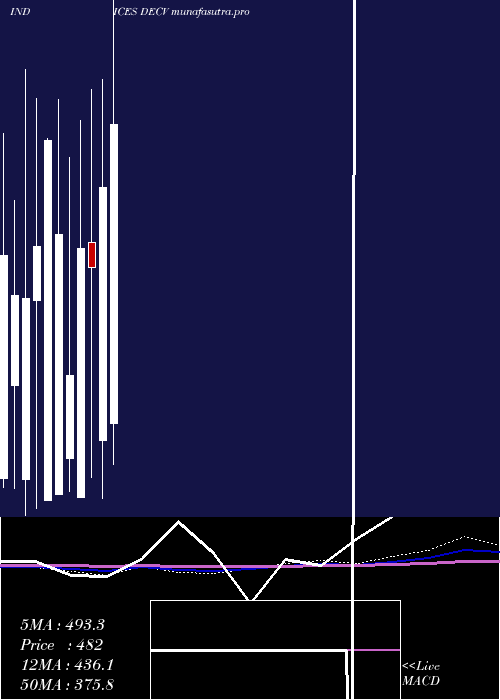
Daily price and volume Tsxv Declining
| Date |
Closing |
Open |
Range |
Volume |
Mon 20 October 2025 |
344.00 (-44.69%) |
192.00 |
192.00 - 364.00 |
0.6406 times |
Fri 17 October 2025 |
622.00 (22.92%) |
359.00 |
359.00 - 647.00 |
1.7067 times |
Thu 16 October 2025 |
506.00 (25.87%) |
198.00 |
198.00 - 507.00 |
1.1685 times |
Wed 15 October 2025 |
402.00 (20.72%) |
207.00 |
207.00 - 410.00 |
1.0094 times |
Tue 14 October 2025 |
333.00 (-27.45%) |
238.00 |
238.00 - 336.00 |
0.5164 times |
Fri 10 October 2025 |
459.00 (-8.57%) |
212.00 |
212.00 - 468.00 |
1.1787 times |
Thu 09 October 2025 |
502.00 (68.46%) |
243.00 |
243.00 - 502.00 |
1.4577 times |
Wed 08 October 2025 |
298.00 (-38.93%) |
167.00 |
167.00 - 308.00 |
0.546 times |
Tue 07 October 2025 |
488.00 (48.33%) |
239.00 |
239.00 - 489.00 |
1.0561 times |
Mon 06 October 2025 |
329.00 (3.13%) |
192.00 |
192.00 - 337.00 |
0.7199 times |
Fri 03 October 2025 |
319.00 (-5.34%) |
187.00 |
187.00 - 338.00 |
0.6245 times |
Weekly price and charts TsxvDeclining Strong weekly Stock price targets for TsxvDeclining DECV are 268 and 440 | Weekly Target 1 | 128 | | Weekly Target 2 | 236 | | Weekly Target 3 | 300 | | Weekly Target 4 | 408 | | Weekly Target 5 | 472 |
Weekly price and volumes for Tsxv Declining
| Date |
Closing |
Open |
Range |
Volume |
Mon 20 October 2025 |
344.00 (-44.69%) |
192.00 |
192.00 - 364.00 |
0.2276 times |
Fri 17 October 2025 |
622.00 (35.51%) |
238.00 |
198.00 - 647.00 |
1.5637 times |
Fri 10 October 2025 |
459.00 (43.89%) |
192.00 |
167.00 - 502.00 |
1.7617 times |
Fri 03 October 2025 |
319.00 (8.5%) |
170.00 |
170.00 - 487.00 |
1.1248 times |
Fri 26 September 2025 |
294.00 (3.16%) |
185.00 |
185.00 - 451.00 |
1.2703 times |
Fri 19 September 2025 |
285.00 (-23.18%) |
221.00 |
181.00 - 453.00 |
1.2071 times |
Fri 12 September 2025 |
371.00 (38.43%) |
209.00 |
163.00 - 431.00 |
1.057 times |
Fri 05 September 2025 |
268.00 (-5.3%) |
192.00 |
148.00 - 438.00 |
0.8335 times |
Fri 29 August 2025 |
283.00 (0%) |
188.00 |
188.00 - 308.00 |
0.1229 times |
Fri 29 August 2025 |
283.00 (17.92%) |
217.00 |
164.00 - 377.00 |
0.8313 times |
Fri 22 August 2025 |
240.00 (-30.23%) |
185.00 |
144.00 - 491.00 |
0.7279 times |
Monthly price and charts TsxvDeclining Strong monthly Stock price targets for TsxvDeclining DECV are 255.5 and 735.5 | Monthly Target 1 | -94 | | Monthly Target 2 | 125 | | Monthly Target 3 | 386 | | Monthly Target 4 | 605 | | Monthly Target 5 | 866 |
Monthly price and volumes Tsxv Declining
| Date |
Closing |
Open |
Range |
Volume |
Mon 20 October 2025 |
344.00 (-26.34%) |
191.00 |
167.00 - 647.00 |
1.277 times |
Tue 30 September 2025 |
467.00 (65.02%) |
192.00 |
148.00 - 487.00 |
1.5497 times |
Fri 29 August 2025 |
283.00 (-11.01%) |
77.00 |
77.00 - 491.00 |
0.9982 times |
Thu 31 July 2025 |
318.00 (6.71%) |
187.00 |
148.00 - 470.00 |
1.082 times |
Mon 30 June 2025 |
298.00 (-16.29%) |
205.00 |
148.00 - 418.00 |
0.9084 times |
Fri 30 May 2025 |
356.00 (-5.57%) |
196.00 |
118.00 - 426.00 |
0.8021 times |
Wed 30 April 2025 |
377.00 (-10.45%) |
193.00 |
65.00 - 646.00 |
0.826 times |
Mon 31 March 2025 |
421.00 (22.38%) |
177.00 |
121.00 - 525.00 |
0.7448 times |
Fri 28 February 2025 |
344.00 (-4.97%) |
368.00 |
141.00 - 515.00 |
0.8347 times |
Fri 31 January 2025 |
362.00 (51.46%) |
122.00 |
122.00 - 485.00 |
0.9773 times |
Tue 31 December 2024 |
239.00 (-36.27%) |
159.00 |
128.00 - 450.00 |
0.729 times |
DMA SMA EMA moving averages of Tsxv Declining DECV
DMA (daily moving average) of Tsxv Declining DECV
| DMA period | DMA value | | 5 day DMA | 441.4 | | 12 day DMA | 411.58 | | 20 day DMA | 396.1 | | 35 day DMA | 382.31 | | 50 day DMA | 374.88 | | 100 day DMA | 362.37 | | 150 day DMA | 357.36 | | 200 day DMA | 354.54 | EMA (exponential moving average) of Tsxv Declining DECV
| EMA period | EMA current | EMA prev | EMA prev2 | | 5 day EMA | 445.51 | 496.25 | 433.38 | | 12 day EMA | 426.07 | 440.99 | 408.09 | | 20 day EMA | 409.96 | 416.9 | 395.32 | | 35 day EMA | 392.31 | 395.15 | 381.79 | | 50 day EMA | 379.51 | 380.96 | 371.13 |
SMA (simple moving average) of Tsxv Declining DECV
| SMA period | SMA current | SMA prev | SMA prev2 | | 5 day SMA | 441.4 | 464.4 | 440.4 | | 12 day SMA | 411.58 | 421.83 | 399.92 | | 20 day SMA | 396.1 | 396.4 | 385.2 | | 35 day SMA | 382.31 | 381.6 | 374.06 | | 50 day SMA | 374.88 | 374.88 | 370.18 | | 100 day SMA | 362.37 | 362.62 | 359.67 | | 150 day SMA | 357.36 | 357.03 | 355.28 | | 200 day SMA | 354.54 | 354.51 | 352.79 |
|
|
