TsxDeclining DECS full analysis,charts,indicators,moving averages,SMA,DMA,EMA,ADX,MACD,RSITsx Declining DECS WideScreen charts, DMA,SMA,EMA technical analysis, forecast prediction, by indicators ADX,MACD,RSI,CCI INDICES stock exchange
Daily price and charts and targets TsxDeclining Strong Daily Stock price targets for TsxDeclining DECS are 785.5 and 1053.5 | Daily Target 1 | 569.33 | | Daily Target 2 | 733.67 | | Daily Target 3 | 837.33333333333 | | Daily Target 4 | 1001.67 | | Daily Target 5 | 1105.33 |
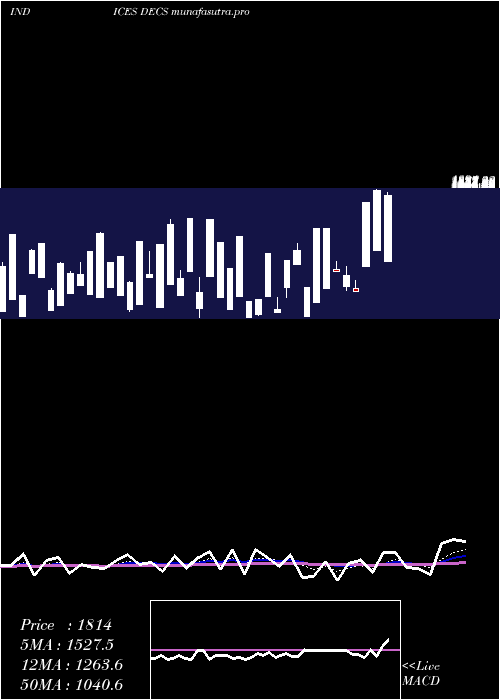
Daily price and volume Tsx Declining
| Date |
Closing |
Open |
Range |
Volume |
Thu 04 December 2025 |
898.00 (25.77%) |
687.00 |
673.00 - 941.00 |
0.9906 times |
Wed 03 December 2025 |
714.00 (-32%) |
429.00 |
429.00 - 738.00 |
0 times |
Tue 02 December 2025 |
1050.00 (-24.08%) |
888.00 |
888.00 - 1080.00 |
1.9826 times |
Mon 01 December 2025 |
1383.00 (68.66%) |
1028.00 |
1028.00 - 1384.00 |
1.8264 times |
Fri 28 November 2025 |
820.00 (57.09%) |
684.00 |
684.00 - 873.00 |
0.6123 times |
Wed 26 November 2025 |
522.00 (0%) |
346.00 |
346.00 - 524.00 |
0.8307 times |
Tue 25 November 2025 |
522.00 (-0.19%) |
559.00 |
520.00 - 627.00 |
1.0804 times |
Mon 24 November 2025 |
523.00 (-26.23%) |
312.00 |
312.00 - 523.00 |
0 times |
Fri 21 November 2025 |
709.00 (-54.9%) |
433.00 |
433.00 - 816.00 |
0 times |
Thu 20 November 2025 |
1572.00 (59.27%) |
212.00 |
212.00 - 1572.00 |
2.677 times |
Wed 19 November 2025 |
987.00 (-23.84%) |
443.00 |
443.00 - 1045.00 |
1.0087 times |
Weekly price and charts TsxDeclining Strong weekly Stock price targets for TsxDeclining DECS are 186 and 1141 | Weekly Target 1 | -51.33 | | Weekly Target 2 | 423.33 | | Weekly Target 3 | 903.66666666667 | | Weekly Target 4 | 1378.33 | | Weekly Target 5 | 1858.67 |
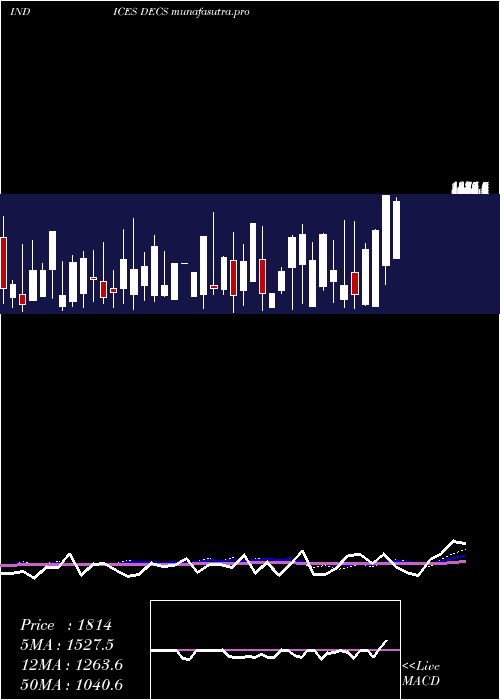
Weekly price and volumes for Tsx Declining
| Date |
Closing |
Open |
Range |
Volume |
Thu 04 December 2025 |
898.00 (9.51%) |
1028.00 |
429.00 - 1384.00 |
0.7786 times |
Fri 28 November 2025 |
820.00 (15.66%) |
312.00 |
312.00 - 873.00 |
0.4093 times |
Fri 21 November 2025 |
709.00 (-44.26%) |
519.00 |
212.00 - 1572.00 |
1.2936 times |
Fri 14 November 2025 |
1272.00 (9.94%) |
138.00 |
138.00 - 1665.00 |
1.218 times |
Fri 07 November 2025 |
1157.00 (31.78%) |
744.00 |
316.00 - 1644.00 |
1.0239 times |
Fri 31 October 2025 |
878.00 (0%) |
581.00 |
581.00 - 1008.00 |
0.266 times |
Fri 31 October 2025 |
878.00 (52.17%) |
499.00 |
499.00 - 1394.00 |
1.2722 times |
Fri 24 October 2025 |
577.00 (-51.63%) |
214.00 |
214.00 - 1177.00 |
1.0156 times |
Fri 17 October 2025 |
1193.00 (-24.11%) |
332.00 |
262.00 - 1263.00 |
1.2621 times |
Fri 10 October 2025 |
1572.00 (189.5%) |
336.00 |
336.00 - 1572.00 |
1.4608 times |
Fri 03 October 2025 |
543.00 (-10.4%) |
500.00 |
340.00 - 1062.00 |
0.7563 times |
Monthly price and charts TsxDeclining Strong monthly Stock price targets for TsxDeclining DECS are 186 and 1141 | Monthly Target 1 | -51.33 | | Monthly Target 2 | 423.33 | | Monthly Target 3 | 903.66666666667 | | Monthly Target 4 | 1378.33 | | Monthly Target 5 | 1858.67 |
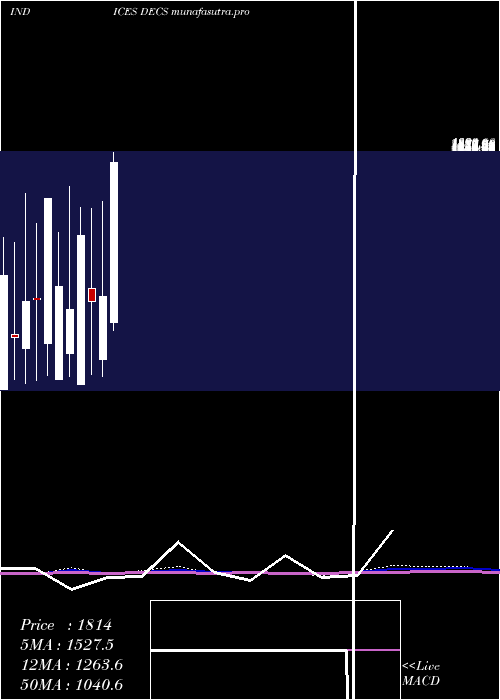
Monthly price and volumes Tsx Declining
| Date |
Closing |
Open |
Range |
Volume |
Thu 04 December 2025 |
898.00 (9.51%) |
1028.00 |
429.00 - 1384.00 |
0.1906 times |
Fri 28 November 2025 |
820.00 (-6.61%) |
744.00 |
138.00 - 1665.00 |
0.9656 times |
Fri 31 October 2025 |
878.00 (9.61%) |
452.00 |
214.00 - 1572.00 |
1.3611 times |
Tue 30 September 2025 |
801.00 (-23.35%) |
595.00 |
215.00 - 1320.00 |
1.0999 times |
Fri 29 August 2025 |
1045.00 (-15.04%) |
567.00 |
223.00 - 1420.00 |
0.9363 times |
Thu 31 July 2025 |
1230.00 (80.88%) |
598.00 |
339.00 - 1301.00 |
0.9844 times |
Mon 30 June 2025 |
680.00 (-39.39%) |
628.00 |
292.00 - 1325.00 |
1.0085 times |
Fri 30 May 2025 |
1122.00 (1.72%) |
416.00 |
242.00 - 1523.00 |
1.0816 times |
Wed 30 April 2025 |
1103.00 (31.15%) |
651.00 |
131.00 - 1891.00 |
1.2435 times |
Mon 31 March 2025 |
841.00 (4.47%) |
382.00 |
253.00 - 1529.00 |
1.1285 times |
Fri 28 February 2025 |
805.00 (-37.26%) |
898.00 |
273.00 - 1480.00 |
1.0536 times |
DMA SMA EMA moving averages of Tsx Declining DECS
DMA (daily moving average) of Tsx Declining DECS
| DMA period | DMA value | | 5 day DMA | 973 | | 12 day DMA | 916.33 | | 20 day DMA | 987.8 | | 35 day DMA | 983.66 | | 50 day DMA | 963.3 | | 100 day DMA | 910.11 | | 150 day DMA | 880.67 | | 200 day DMA | 906.85 | EMA (exponential moving average) of Tsx Declining DECS
| EMA period | EMA current | EMA prev | EMA prev2 | | 5 day EMA | 895.95 | 894.92 | 985.36 | | 12 day EMA | 923.61 | 928.27 | 967.22 | | 20 day EMA | 947.4 | 952.6 | 977.7 | | 35 day EMA | 954.89 | 958.24 | 972.62 | | 50 day EMA | 957.55 | 959.98 | 970.02 |
SMA (simple moving average) of Tsx Declining DECS
| SMA period | SMA current | SMA prev | SMA prev2 | | 5 day SMA | 973 | 897.8 | 859.4 | | 12 day SMA | 916.33 | 971.17 | 1017.67 | | 20 day SMA | 987.8 | 968.9 | 1015.4 | | 35 day SMA | 983.66 | 976.71 | 972.11 | | 50 day SMA | 963.3 | 960.06 | 962.8 | | 100 day SMA | 910.11 | 912.28 | 911.76 | | 150 day SMA | 880.67 | 878.96 | 879.48 | | 200 day SMA | 906.85 | 905.05 | 908.09 |
|
|
