NasdDeclining DECQ full analysis,charts,indicators,moving averages,SMA,DMA,EMA,ADX,MACD,RSINasd Declining DECQ WideScreen charts, DMA,SMA,EMA technical analysis, forecast prediction, by indicators ADX,MACD,RSI,CCI INDICES stock exchange
Daily price and charts and targets NasdDeclining Strong Daily Stock price targets for NasdDeclining DECQ are 1034.5 and 1272.5 | Daily Target 1 | 982.67 | | Daily Target 2 | 1086.33 | | Daily Target 3 | 1220.6666666667 | | Daily Target 4 | 1324.33 | | Daily Target 5 | 1458.67 |
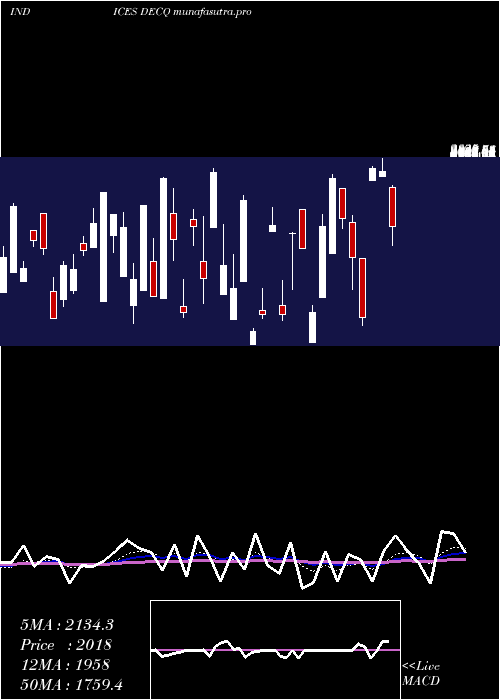
Daily price and volume Nasd Declining
| Date |
Closing |
Open |
Range |
Volume |
Thu 04 December 2025 |
1190.00 (50.82%) |
1274.00 |
1117.00 - 1355.00 |
1.5579 times |
Wed 03 December 2025 |
789.00 (-55.27%) |
1007.00 |
789.00 - 1113.00 |
0 times |
Tue 02 December 2025 |
1764.00 (-19.89%) |
1458.00 |
1458.00 - 1765.00 |
1.5579 times |
Mon 01 December 2025 |
2202.00 (96.43%) |
1914.00 |
1914.00 - 2203.00 |
1.5579 times |
Fri 28 November 2025 |
1121.00 (-1.75%) |
1120.00 |
993.00 - 1268.00 |
0.8695 times |
Wed 26 November 2025 |
1141.00 (35.67%) |
1144.00 |
913.00 - 1267.00 |
1.3408 times |
Tue 25 November 2025 |
841.00 (-22.13%) |
1180.00 |
841.00 - 1180.00 |
1.5579 times |
Mon 24 November 2025 |
1080.00 (37.58%) |
1186.00 |
978.00 - 1326.00 |
0 times |
Fri 21 November 2025 |
785.00 (-66.28%) |
912.00 |
687.00 - 1409.00 |
0 times |
Thu 20 November 2025 |
2328.00 (19.2%) |
394.00 |
394.00 - 2338.00 |
1.5579 times |
Wed 19 November 2025 |
1953.00 (32.23%) |
1303.00 |
1211.00 - 2105.00 |
1.5579 times |
Weekly price and charts NasdDeclining Strong weekly Stock price targets for NasdDeclining DECQ are 282.5 and 1696.5 | Weekly Target 1 | -20 | | Weekly Target 2 | 585 | | Weekly Target 3 | 1394 | | Weekly Target 4 | 1999 | | Weekly Target 5 | 2808 |
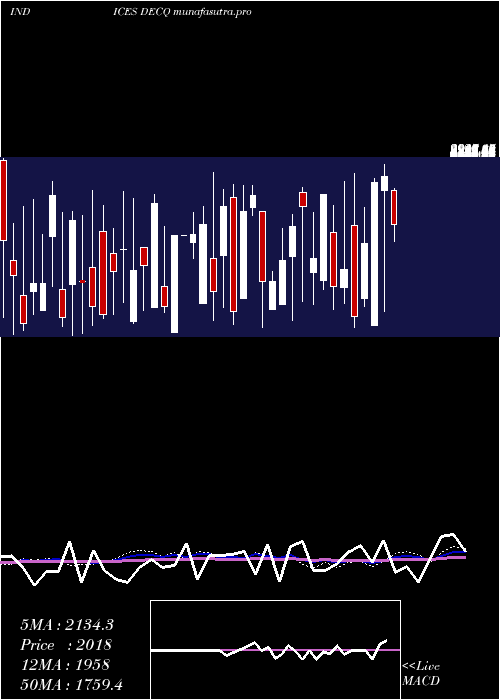
Weekly price and volumes for Nasd Declining
| Date |
Closing |
Open |
Range |
Volume |
Thu 04 December 2025 |
1190.00 (6.16%) |
1914.00 |
789.00 - 2203.00 |
1.5449 times |
Fri 28 November 2025 |
1121.00 (42.8%) |
1186.00 |
841.00 - 1326.00 |
1.2456 times |
Fri 21 November 2025 |
785.00 (-55.85%) |
1462.00 |
394.00 - 2366.00 |
2.0599 times |
Fri 14 November 2025 |
1778.00 (9.82%) |
592.00 |
592.00 - 2487.00 |
2.5748 times |
Fri 07 November 2025 |
1619.00 (10.06%) |
1852.00 |
1533.00 - 2302.00 |
0 times |
Fri 07 November 2025 |
1471.00 (-38.61%) |
1497.00 |
1469.00 - 2403.00 |
0.515 times |
Thu 06 November 2025 |
2396.00 (113.74%) |
1117.00 |
983.00 - 2403.00 |
0.515 times |
Wed 05 November 2025 |
1121.00 (-53.81%) |
2244.00 |
983.00 - 2446.00 |
0.515 times |
Tue 04 November 2025 |
2427.00 (88.29%) |
2244.00 |
2104.00 - 2446.00 |
0.515 times |
Fri 31 October 2025 |
1289.00 (0.08%) |
1394.00 |
1219.00 - 1656.00 |
0.515 times |
Fri 31 October 2025 |
1288.00 (0%) |
1422.00 |
1219.00 - 1656.00 |
0 times |
Monthly price and charts NasdDeclining Strong monthly Stock price targets for NasdDeclining DECQ are 282.5 and 1696.5 | Monthly Target 1 | -20 | | Monthly Target 2 | 585 | | Monthly Target 3 | 1394 | | Monthly Target 4 | 1999 | | Monthly Target 5 | 2808 |
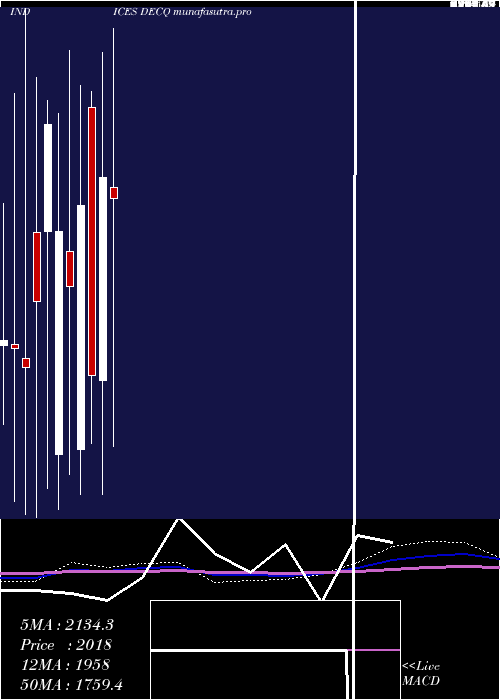
Monthly price and volumes Nasd Declining
| Date |
Closing |
Open |
Range |
Volume |
Thu 04 December 2025 |
1190.00 (6.16%) |
1914.00 |
789.00 - 2203.00 |
0.1703 times |
Fri 28 November 2025 |
1121.00 (-13.03%) |
2244.00 |
394.00 - 2487.00 |
0.8751 times |
Fri 31 October 2025 |
1289.00 (-22.58%) |
1602.00 |
511.00 - 2811.00 |
1.3003 times |
Tue 30 September 2025 |
1665.00 (-9.26%) |
2031.00 |
640.00 - 2410.00 |
1.1764 times |
Fri 29 August 2025 |
1835.00 (-14.85%) |
2146.00 |
392.00 - 2543.00 |
1.1385 times |
Thu 31 July 2025 |
2155.00 (51.76%) |
1797.00 |
747.00 - 2361.00 |
1.1634 times |
Mon 30 June 2025 |
1420.00 (-28.43%) |
1808.00 |
581.00 - 2595.00 |
1.0042 times |
Fri 30 May 2025 |
1984.00 (14.88%) |
1334.00 |
396.00 - 2593.00 |
1.1728 times |
Wed 30 April 2025 |
1727.00 (-18.46%) |
2070.00 |
374.00 - 2835.00 |
1.0318 times |
Mon 31 March 2025 |
2118.00 (81.18%) |
1145.00 |
597.00 - 2718.00 |
0.9671 times |
Fri 28 February 2025 |
1169.00 (-41.08%) |
2453.00 |
845.00 - 2529.00 |
1.0549 times |
DMA SMA EMA moving averages of Nasd Declining DECQ
DMA (daily moving average) of Nasd Declining DECQ
| DMA period | DMA value | | 5 day DMA | 1413.2 | | 12 day DMA | 1389.25 | | 20 day DMA | 1524.05 | | 35 day DMA | 1655.6 | | 50 day DMA | 1607.8 | | 100 day DMA | 1596.4 | | 150 day DMA | 1596.09 | | 200 day DMA | 1585.3 | EMA (exponential moving average) of Nasd Declining DECQ
| EMA period | EMA current | EMA prev | EMA prev2 | | 5 day EMA | 1283.16 | 1329.74 | 1600.07 | | 12 day EMA | 1401.12 | 1439.49 | 1557.72 | | 20 day EMA | 1482.66 | 1513.45 | 1589.67 | | 35 day EMA | 1537.82 | 1558.3 | 1603.59 | | 50 day EMA | 1595.67 | 1612.22 | 1645.81 |
SMA (simple moving average) of Nasd Declining DECQ
| SMA period | SMA current | SMA prev | SMA prev2 | | 5 day SMA | 1413.2 | 1403.4 | 1413.8 | | 12 day SMA | 1389.25 | 1485.92 | 1568.33 | | 20 day SMA | 1524.05 | 1584.4 | 1664.75 | | 35 day SMA | 1655.6 | 1677.91 | 1700.86 | | 50 day SMA | 1607.8 | 1631.18 | 1662.58 | | 100 day SMA | 1596.4 | 1601.54 | 1608.75 | | 150 day SMA | 1596.09 | 1594.15 | 1601.79 | | 200 day SMA | 1585.3 | 1585.72 | 1589.51 |
|
|
