NyseDeclining DECN full analysis,charts,indicators,moving averages,SMA,DMA,EMA,ADX,MACD,RSINyse Declining DECN WideScreen charts, DMA,SMA,EMA technical analysis, forecast prediction, by indicators ADX,MACD,RSI,CCI INDICES stock exchange
Daily price and charts and targets NyseDeclining Strong Daily Stock price targets for NyseDeclining DECN are 794 and 1266 | Daily Target 1 | 403.67 | | Daily Target 2 | 712.33 | | Daily Target 3 | 875.66666666667 | | Daily Target 4 | 1184.33 | | Daily Target 5 | 1347.67 |
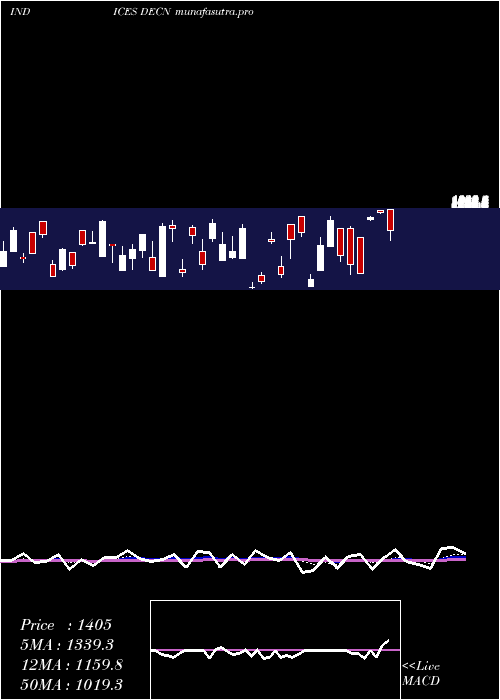
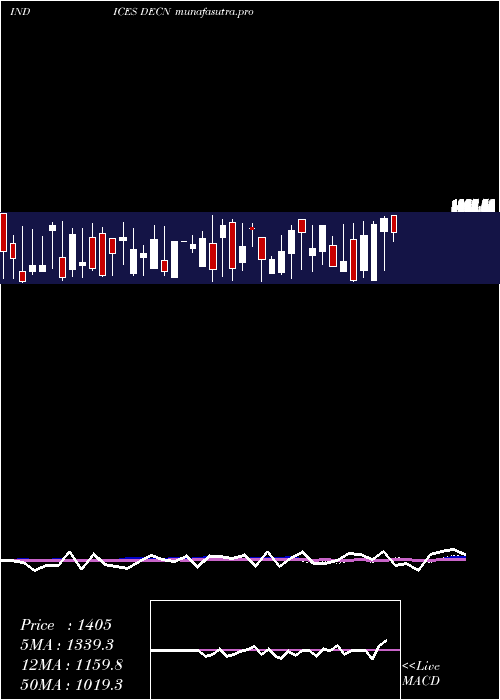
Daily price and volume Nyse Declining
| Date |
Closing |
Open |
Range |
Volume |
Fri 05 December 2025 |
1021.00 (5.91%) |
967.00 |
567.00 - 1039.00 |
1.9116 times |
Thu 04 December 2025 |
964.00 (97.14%) |
863.00 |
807.00 - 1008.00 |
1.5946 times |
Wed 03 December 2025 |
489.00 (-54.6%) |
407.00 |
407.00 - 590.00 |
0 times |
Tue 02 December 2025 |
1077.00 (-10.18%) |
982.00 |
891.00 - 1131.00 |
1.9116 times |
Mon 01 December 2025 |
1199.00 (94.64%) |
957.00 |
874.00 - 1199.00 |
1.9116 times |
Fri 28 November 2025 |
616.00 (7.32%) |
729.00 |
510.00 - 729.00 |
0.4694 times |
Wed 26 November 2025 |
574.00 (93.27%) |
582.00 |
308.00 - 582.00 |
1.159 times |
Tue 25 November 2025 |
297.00 (-63.65%) |
537.00 |
297.00 - 537.00 |
1.0423 times |
Mon 24 November 2025 |
817.00 (205.99%) |
1215.00 |
741.00 - 1241.00 |
0 times |
Fri 21 November 2025 |
267.00 (-81.28%) |
477.00 |
189.00 - 605.00 |
0 times |
Thu 20 November 2025 |
1426.00 (27.78%) |
196.00 |
196.00 - 1427.00 |
1.9116 times |
Weekly price and charts NyseDeclining Strong weekly Stock price targets for NyseDeclining DECN are 714 and 1506 | Weekly Target 1 | 83.67 | | Weekly Target 2 | 552.33 | | Weekly Target 3 | 875.66666666667 | | Weekly Target 4 | 1344.33 | | Weekly Target 5 | 1667.67 |
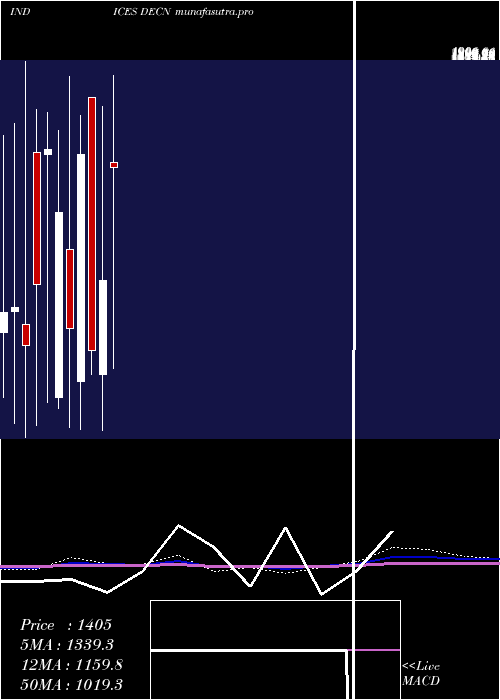
Weekly price and volumes for Nyse Declining
| Date |
Closing |
Open |
Range |
Volume |
Fri 05 December 2025 |
1021.00 (65.75%) |
957.00 |
407.00 - 1199.00 |
2.1915 times |
Fri 28 November 2025 |
616.00 (130.71%) |
1215.00 |
297.00 - 1241.00 |
0.7986 times |
Fri 21 November 2025 |
267.00 (-75.68%) |
1146.00 |
189.00 - 1641.00 |
2.2223 times |
Fri 14 November 2025 |
1098.00 (61.95%) |
625.00 |
496.00 - 1447.00 |
2.6518 times |
Fri 07 November 2025 |
678.00 (18.74%) |
1062.00 |
574.00 - 1062.00 |
0 times |
Fri 07 November 2025 |
571.00 (-55.74%) |
866.00 |
571.00 - 1350.00 |
0.4612 times |
Thu 06 November 2025 |
1290.00 (124.35%) |
696.00 |
436.00 - 1350.00 |
0.5716 times |
Wed 05 November 2025 |
575.00 (-54.58%) |
1443.00 |
436.00 - 1443.00 |
0.5315 times |
Tue 04 November 2025 |
1266.00 (59.85%) |
1443.00 |
1205.00 - 1443.00 |
0.5716 times |
Fri 31 October 2025 |
792.00 (0.13%) |
1170.00 |
724.00 - 1170.00 |
0 times |
Fri 31 October 2025 |
791.00 (-0.13%) |
1016.00 |
724.00 - 1066.00 |
0.5716 times |
Monthly price and charts NyseDeclining Strong monthly Stock price targets for NyseDeclining DECN are 714 and 1506 | Monthly Target 1 | 83.67 | | Monthly Target 2 | 552.33 | | Monthly Target 3 | 875.66666666667 | | Monthly Target 4 | 1344.33 | | Monthly Target 5 | 1667.67 |
Monthly price and volumes Nyse Declining
| Date |
Closing |
Open |
Range |
Volume |
Fri 05 December 2025 |
1021.00 (65.75%) |
957.00 |
407.00 - 1199.00 |
0.237 times |
Fri 28 November 2025 |
616.00 (-22.22%) |
1443.00 |
189.00 - 1641.00 |
0.8446 times |
Fri 31 October 2025 |
792.00 (-10.31%) |
1089.00 |
214.00 - 1689.00 |
1.3 times |
Tue 30 September 2025 |
883.00 (-2.97%) |
1643.00 |
293.00 - 1643.00 |
1.2088 times |
Fri 29 August 2025 |
910.00 (-29.51%) |
1364.00 |
89.00 - 1666.00 |
1.1239 times |
Thu 31 July 2025 |
1291.00 (51.7%) |
1039.00 |
335.00 - 1640.00 |
1.1506 times |
Mon 30 June 2025 |
851.00 (-26.26%) |
1473.00 |
218.00 - 1597.00 |
1.0378 times |
Fri 30 May 2025 |
1154.00 (6.65%) |
664.00 |
148.00 - 1724.00 |
1.2093 times |
Wed 30 April 2025 |
1082.00 (24.94%) |
1428.00 |
48.00 - 1838.00 |
0.9086 times |
Mon 31 March 2025 |
866.00 (61.87%) |
420.00 |
155.00 - 1691.00 |
0.9793 times |
Fri 28 February 2025 |
535.00 (-63.48%) |
1735.00 |
419.00 - 1735.00 |
1.0688 times |
DMA SMA EMA moving averages of Nyse Declining DECN
DMA (daily moving average) of Nyse Declining DECN
| DMA period | DMA value | | 5 day DMA | 950 | | 12 day DMA | 821.92 | | 20 day DMA | 883.6 | | 35 day DMA | 935.09 | | 50 day DMA | 899.24 | | 100 day DMA | 922.98 | | 150 day DMA | 917.61 | | 200 day DMA | 912.36 | EMA (exponential moving average) of Nyse Declining DECN
| EMA period | EMA current | EMA prev | EMA prev2 | | 5 day EMA | 895.68 | 833.03 | 767.56 | | 12 day EMA | 866.28 | 838.16 | 815.29 | | 20 day EMA | 876.68 | 861.49 | 850.7 | | 35 day EMA | 891.02 | 883.37 | 878.62 | | 50 day EMA | 916 | 911.72 | 909.59 |
SMA (simple moving average) of Nyse Declining DECN
| SMA period | SMA current | SMA prev | SMA prev2 | | 5 day SMA | 950 | 869 | 791 | | 12 day SMA | 821.92 | 800.17 | 854.58 | | 20 day SMA | 883.6 | 861.1 | 877.45 | | 35 day SMA | 935.09 | 941.77 | 950.09 | | 50 day SMA | 899.24 | 895.28 | 903.7 | | 100 day SMA | 922.98 | 915.46 | 916.91 | | 150 day SMA | 917.61 | 920.34 | 915.41 | | 200 day SMA | 912.36 | 908.21 | 910.55 |
|
|
