EtfsDeclining DECE full analysis,charts,indicators,moving averages,SMA,DMA,EMA,ADX,MACD,RSIEtfs Declining DECE WideScreen charts, DMA,SMA,EMA technical analysis, forecast prediction, by indicators ADX,MACD,RSI,CCI INDICES stock exchange
Daily price and charts and targets EtfsDeclining Strong Daily Stock price targets for EtfsDeclining DECE are 1819.5 and 2359.5 | Daily Target 1 | 1396 | | Daily Target 2 | 1703 | | Daily Target 3 | 1936 | | Daily Target 4 | 2243 | | Daily Target 5 | 2476 |
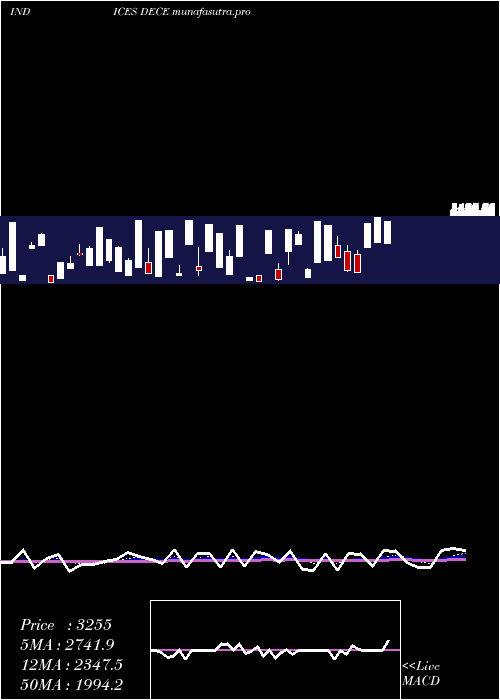
Daily price and volume Etfs Declining
| Date |
Closing |
Open |
Range |
Volume |
Thu 04 December 2025 |
2010.00 (183.5%) |
1835.00 |
1629.00 - 2169.00 |
1.4925 times |
Wed 03 December 2025 |
709.00 (-52.73%) |
1022.00 |
688.00 - 1167.00 |
0 times |
Tue 02 December 2025 |
1500.00 (-59.69%) |
1326.00 |
1176.00 - 1599.00 |
1.4414 times |
Mon 01 December 2025 |
3721.00 (312.53%) |
2582.00 |
2582.00 - 3725.00 |
2.0161 times |
Fri 28 November 2025 |
902.00 (115.79%) |
882.00 |
834.00 - 908.00 |
0.6182 times |
Wed 26 November 2025 |
418.00 (-30.68%) |
691.00 |
403.00 - 816.00 |
0.9155 times |
Tue 25 November 2025 |
603.00 (-0.66%) |
1405.00 |
602.00 - 1456.00 |
1.5002 times |
Mon 24 November 2025 |
607.00 (-22.68%) |
691.00 |
557.00 - 917.00 |
0 times |
Fri 21 November 2025 |
785.00 (-78.55%) |
757.00 |
667.00 - 1502.00 |
0 times |
Thu 20 November 2025 |
3659.00 (55.37%) |
247.00 |
247.00 - 3659.00 |
2.0161 times |
Wed 19 November 2025 |
2355.00 (-9.46%) |
1125.00 |
1078.00 - 2487.00 |
2.0161 times |
Weekly price and charts EtfsDeclining Strong weekly Stock price targets for EtfsDeclining DECE are -169.5 and 2867.5 | Weekly Target 1 | -896 | | Weekly Target 2 | 557 | | Weekly Target 3 | 2141 | | Weekly Target 4 | 3594 | | Weekly Target 5 | 5178 |
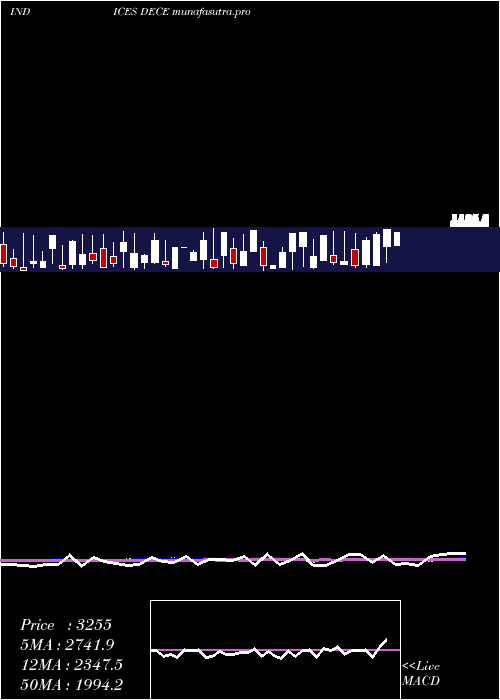
Weekly price and volumes for Etfs Declining
| Date |
Closing |
Open |
Range |
Volume |
Thu 04 December 2025 |
2010.00 (122.84%) |
2582.00 |
688.00 - 3725.00 |
1.5686 times |
Fri 28 November 2025 |
902.00 (14.9%) |
691.00 |
403.00 - 1456.00 |
0.9614 times |
Fri 21 November 2025 |
785.00 (-71.26%) |
1518.00 |
247.00 - 3659.00 |
2.5554 times |
Fri 14 November 2025 |
2731.00 (35.06%) |
436.00 |
436.00 - 4075.00 |
2.6004 times |
Fri 07 November 2025 |
2022.00 (37.55%) |
1864.00 |
1864.00 - 2758.00 |
0 times |
Fri 07 November 2025 |
1470.00 (-53.98%) |
1187.00 |
1187.00 - 3194.00 |
0.559 times |
Thu 06 November 2025 |
3194.00 (189.84%) |
1122.00 |
941.00 - 3194.00 |
0.6389 times |
Wed 05 November 2025 |
1102.00 (-68.4%) |
2133.00 |
941.00 - 3186.00 |
0.4775 times |
Tue 04 November 2025 |
3487.00 (123.38%) |
2133.00 |
2133.00 - 3487.00 |
0.6389 times |
Fri 31 October 2025 |
1561.00 (0.19%) |
973.00 |
973.00 - 2149.00 |
0 times |
Fri 31 October 2025 |
1558.00 (-0.19%) |
1125.00 |
1125.00 - 2149.00 |
0.5486 times |
Monthly price and charts EtfsDeclining Strong monthly Stock price targets for EtfsDeclining DECE are -169.5 and 2867.5 | Monthly Target 1 | -896 | | Monthly Target 2 | 557 | | Monthly Target 3 | 2141 | | Monthly Target 4 | 3594 | | Monthly Target 5 | 5178 |
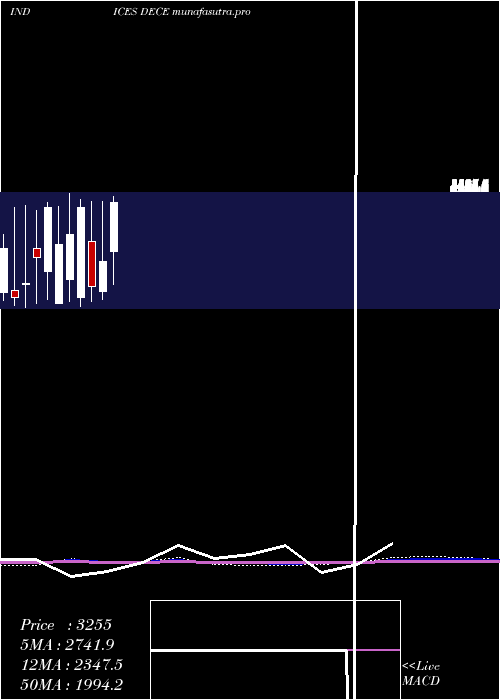
Monthly price and volumes Etfs Declining
| Date |
Closing |
Open |
Range |
Volume |
Thu 04 December 2025 |
2010.00 (122.84%) |
2582.00 |
688.00 - 3725.00 |
0.1766 times |
Fri 28 November 2025 |
902.00 (-42.22%) |
2133.00 |
247.00 - 4075.00 |
0.9494 times |
Fri 31 October 2025 |
1561.00 (20.91%) |
1392.00 |
344.00 - 3673.00 |
1.4246 times |
Tue 30 September 2025 |
1291.00 (-58.54%) |
2186.00 |
269.00 - 3757.00 |
1.1452 times |
Fri 29 August 2025 |
3114.00 (0.94%) |
1447.00 |
208.00 - 3565.00 |
1.1042 times |
Thu 31 July 2025 |
3085.00 (382.03%) |
1661.00 |
408.00 - 3644.00 |
1.0982 times |
Mon 30 June 2025 |
640.00 (-63.39%) |
1729.00 |
415.00 - 3527.00 |
0.8954 times |
Fri 30 May 2025 |
1748.00 (-5.46%) |
733.00 |
325.00 - 3496.00 |
1.1268 times |
Wed 30 April 2025 |
1849.00 (23.02%) |
1827.00 |
254.00 - 3494.00 |
1.0271 times |
Mon 31 March 2025 |
1503.00 (91.22%) |
639.00 |
382.00 - 3282.00 |
1.0524 times |
Fri 28 February 2025 |
786.00 (-74.72%) |
2117.00 |
324.00 - 3295.00 |
0.799 times |
DMA SMA EMA moving averages of Etfs Declining DECE
DMA (daily moving average) of Etfs Declining DECE
| DMA period | DMA value | | 5 day DMA | 1768.4 | | 12 day DMA | 1655.83 | | 20 day DMA | 1885.6 | | 35 day DMA | 2151.54 | | 50 day DMA | 1940.1 | | 100 day DMA | 1938.98 | | 150 day DMA | 1897.17 | | 200 day DMA | 1845.63 | EMA (exponential moving average) of Etfs Declining DECE
| EMA period | EMA current | EMA prev | EMA prev2 | | 5 day EMA | 1612.6 | 1413.93 | 1766.34 | | 12 day EMA | 1700.59 | 1644.35 | 1814.35 | | 20 day EMA | 1818.51 | 1798.36 | 1912.98 | | 35 day EMA | 1861.18 | 1852.42 | 1919.74 | | 50 day EMA | 1920.95 | 1917.32 | 1966.62 |
SMA (simple moving average) of Etfs Declining DECE
| SMA period | SMA current | SMA prev | SMA prev2 | | 5 day SMA | 1768.4 | 1450 | 1428.8 | | 12 day SMA | 1655.83 | 1791.92 | 1960.42 | | 20 day SMA | 1885.6 | 1944.8 | 2069.05 | | 35 day SMA | 2151.54 | 2166.29 | 2169.71 | | 50 day SMA | 1940.1 | 1956.54 | 1999 | | 100 day SMA | 1938.98 | 1947.32 | 1954.21 | | 150 day SMA | 1897.17 | 1886.94 | 1897.53 | | 200 day SMA | 1845.63 | 1850.74 | 1854.98 |
|
|
