AmexDeclining DECA full analysis,charts,indicators,moving averages,SMA,DMA,EMA,ADX,MACD,RSIAmex Declining DECA WideScreen charts, DMA,SMA,EMA technical analysis, forecast prediction, by indicators ADX,MACD,RSI,CCI INDICES stock exchange
Daily price and charts and targets AmexDeclining Strong Daily Stock price targets for AmexDeclining DECA are 102 and 148 | Daily Target 1 | 66.33 | | Daily Target 2 | 91.67 | | Daily Target 3 | 112.33333333333 | | Daily Target 4 | 137.67 | | Daily Target 5 | 158.33 |
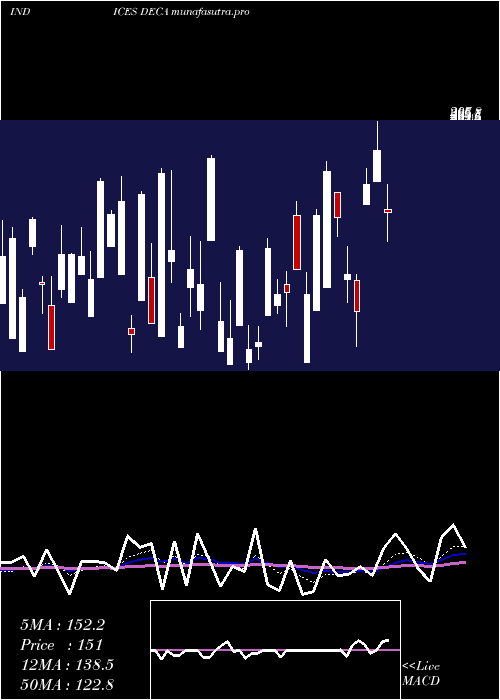
Daily price and volume Amex Declining
| Date |
Closing |
Open |
Range |
Volume |
Fri 05 December 2025 |
117.00 (34.48%) |
90.00 |
87.00 - 133.00 |
2.5482 times |
Thu 04 December 2025 |
87.00 (12.99%) |
88.00 |
83.00 - 99.00 |
0.4233 times |
Wed 03 December 2025 |
77.00 (-41.22%) |
81.00 |
72.00 - 94.00 |
0 times |
Tue 02 December 2025 |
131.00 (-5.76%) |
113.00 |
113.00 - 131.00 |
1.6846 times |
Mon 01 December 2025 |
139.00 (208.89%) |
116.00 |
116.00 - 140.00 |
3.1896 times |
Fri 28 November 2025 |
45.00 (-40.79%) |
42.00 |
42.00 - 57.00 |
0.3631 times |
Wed 26 November 2025 |
76.00 (18.75%) |
78.00 |
48.00 - 78.00 |
0.5068 times |
Tue 25 November 2025 |
64.00 (1.59%) |
126.00 |
64.00 - 126.00 |
1.2843 times |
Mon 24 November 2025 |
63.00 (-25%) |
82.00 |
57.00 - 85.00 |
0 times |
Fri 21 November 2025 |
84.00 (-49.09%) |
112.00 |
79.00 - 128.00 |
0 times |
Thu 20 November 2025 |
165.00 (33.06%) |
59.00 |
59.00 - 168.00 |
4.8954 times |
Weekly price and charts AmexDeclining Strong weekly Stock price targets for AmexDeclining DECA are 94.5 and 162.5 | Weekly Target 1 | 41.67 | | Weekly Target 2 | 79.33 | | Weekly Target 3 | 109.66666666667 | | Weekly Target 4 | 147.33 | | Weekly Target 5 | 177.67 |
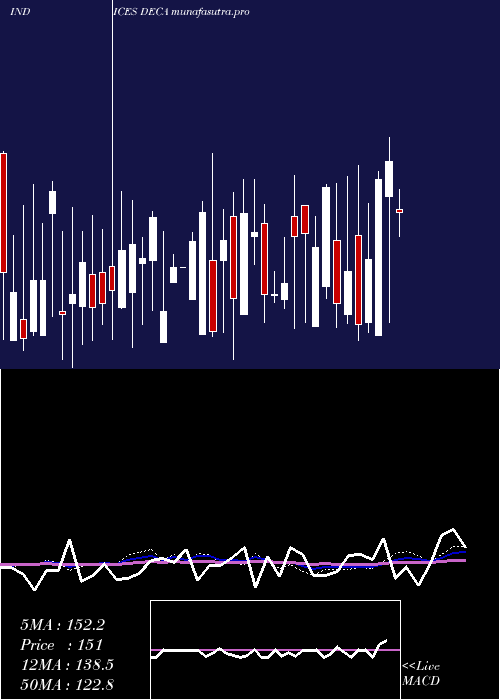
Weekly price and volumes for Amex Declining
| Date |
Closing |
Open |
Range |
Volume |
Fri 05 December 2025 |
117.00 (160%) |
116.00 |
72.00 - 140.00 |
1.5906 times |
Fri 28 November 2025 |
45.00 (-46.43%) |
82.00 |
42.00 - 126.00 |
0.4367 times |
Fri 21 November 2025 |
84.00 (-35.88%) |
104.00 |
59.00 - 168.00 |
2.5781 times |
Fri 14 November 2025 |
131.00 (29.7%) |
43.00 |
43.00 - 177.00 |
2.8411 times |
Fri 07 November 2025 |
101.00 (2.02%) |
130.00 |
95.00 - 155.00 |
0 times |
Fri 07 November 2025 |
99.00 (-37.34%) |
92.00 |
92.00 - 161.00 |
0.2893 times |
Thu 06 November 2025 |
158.00 (125.71%) |
68.00 |
67.00 - 161.00 |
0.8376 times |
Wed 05 November 2025 |
70.00 (-60.45%) |
176.00 |
67.00 - 187.00 |
0.3033 times |
Tue 04 November 2025 |
177.00 (37.21%) |
176.00 |
165.00 - 187.00 |
1.1232 times |
Fri 31 October 2025 |
129.00 (2.38%) |
111.00 |
108.00 - 151.00 |
0 times |
Fri 31 October 2025 |
126.00 (-2.33%) |
114.00 |
108.00 - 151.00 |
0.808 times |
Monthly price and charts AmexDeclining Strong monthly Stock price targets for AmexDeclining DECA are 94.5 and 162.5 | Monthly Target 1 | 41.67 | | Monthly Target 2 | 79.33 | | Monthly Target 3 | 109.66666666667 | | Monthly Target 4 | 147.33 | | Monthly Target 5 | 177.67 |
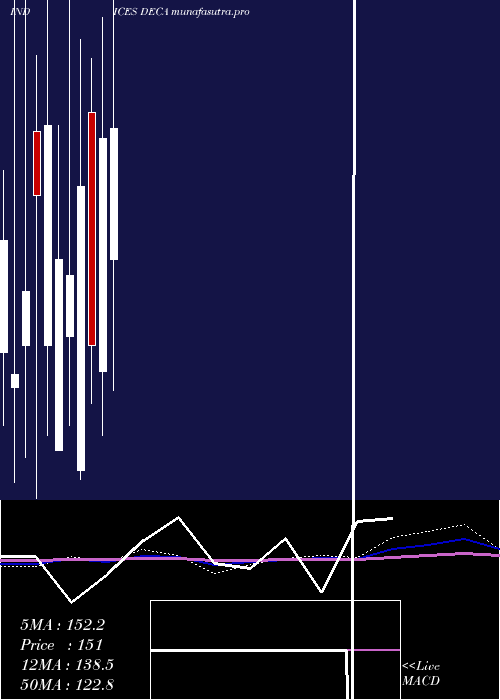
Monthly price and volumes Amex Declining
| Date |
Closing |
Open |
Range |
Volume |
Fri 05 December 2025 |
117.00 (160%) |
116.00 |
72.00 - 140.00 |
0.2048 times |
Fri 28 November 2025 |
45.00 (-65.12%) |
176.00 |
42.00 - 187.00 |
1.0829 times |
Fri 31 October 2025 |
129.00 (-9.79%) |
90.00 |
46.00 - 183.00 |
2.1329 times |
Tue 30 September 2025 |
143.00 (32.41%) |
98.00 |
57.00 - 159.00 |
1.1624 times |
Fri 29 August 2025 |
108.00 (-25%) |
117.00 |
31.00 - 168.00 |
0.8178 times |
Thu 31 July 2025 |
144.00 (38.46%) |
101.00 |
61.00 - 167.00 |
0.9939 times |
Mon 30 June 2025 |
104.00 (-16.8%) |
70.00 |
54.00 - 169.00 |
1.2292 times |
Fri 30 May 2025 |
125.00 (-6.02%) |
103.00 |
60.00 - 159.00 |
0.9533 times |
Wed 30 April 2025 |
133.00 (-10.14%) |
110.00 |
35.00 - 207.00 |
0.7399 times |
Mon 31 March 2025 |
148.00 (78.31%) |
75.00 |
55.00 - 186.00 |
0.6828 times |
Fri 28 February 2025 |
83.00 (-37.59%) |
156.00 |
65.00 - 173.00 |
0.7303 times |
DMA SMA EMA moving averages of Amex Declining DECA
DMA (daily moving average) of Amex Declining DECA
| DMA period | DMA value | | 5 day DMA | 110.2 | | 12 day DMA | 97.67 | | 20 day DMA | 106.05 | | 35 day DMA | 116.31 | | 50 day DMA | 115.74 | | 100 day DMA | 112.4 | | 150 day DMA | 111.29 | | 200 day DMA | 111.28 | EMA (exponential moving average) of Amex Declining DECA
| EMA period | EMA current | EMA prev | EMA prev2 | | 5 day EMA | 101.23 | 93.35 | 96.53 | | 12 day EMA | 101.37 | 98.53 | 100.62 | | 20 day EMA | 105.4 | 104.18 | 105.99 | | 35 day EMA | 110.46 | 110.08 | 111.44 | | 50 day EMA | 117.29 | 117.3 | 118.54 |
SMA (simple moving average) of Amex Declining DECA
| SMA period | SMA current | SMA prev | SMA prev2 | | 5 day SMA | 110.2 | 95.8 | 93.6 | | 12 day SMA | 97.67 | 96.33 | 102.58 | | 20 day SMA | 106.05 | 105.15 | 108.7 | | 35 day SMA | 116.31 | 116.4 | 117.34 | | 50 day SMA | 115.74 | 116.82 | 118.6 | | 100 day SMA | 112.4 | 111.89 | 112.24 | | 150 day SMA | 111.29 | 111.29 | 111.33 | | 200 day SMA | 111.28 | 111.03 | 111.23 |
|
|
