TotalAdvancing ADVT full analysis,charts,indicators,moving averages,SMA,DMA,EMA,ADX,MACD,RSITotal Advancing ADVT WideScreen charts, DMA,SMA,EMA technical analysis, forecast prediction, by indicators ADX,MACD,RSI,CCI INDICES stock exchange
Daily price and charts and targets TotalAdvancing Strong Daily Stock price targets for TotalAdvancing ADVT are 3111 and 3745 | Daily Target 1 | 2594 | | Daily Target 2 | 2994 | | Daily Target 3 | 3228 | | Daily Target 4 | 3628 | | Daily Target 5 | 3862 |
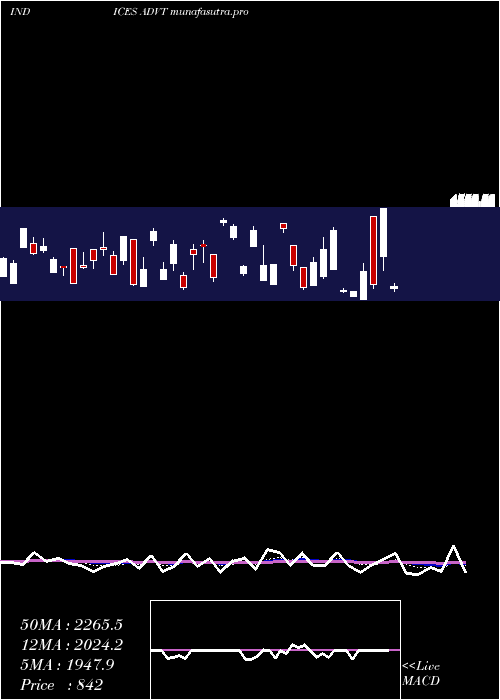
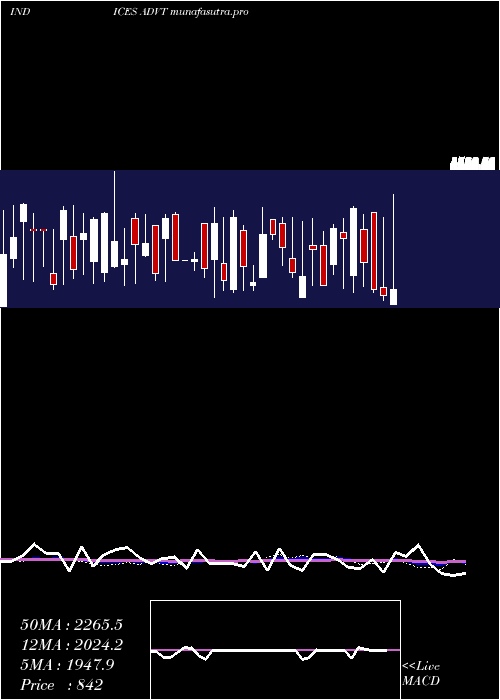
Daily price and volume Total Advancing
| Date |
Closing |
Open |
Range |
Volume |
Thu 23 October 2025 |
3394.00 (3.79%) |
3068.00 |
2828.00 - 3462.00 |
0 times |
Thu 23 October 2025 |
3270.00 (81.26%) |
3068.00 |
2965.00 - 3462.00 |
2 times |
Wed 22 October 2025 |
1804.00 (0.17%) |
2194.00 |
1357.00 - 2194.00 |
0 times |
Wed 22 October 2025 |
1801.00 (-29.26%) |
1919.00 |
1357.00 - 2166.00 |
2 times |
Tue 21 October 2025 |
2546.00 (0.79%) |
1729.00 |
1640.00 - 2870.00 |
0 times |
Tue 21 October 2025 |
2526.00 (-38.35%) |
1729.00 |
1640.00 - 2870.00 |
2 times |
Mon 20 October 2025 |
4097.00 (0.42%) |
3969.00 |
3843.00 - 4158.00 |
0 times |
Mon 20 October 2025 |
4080.00 (80.29%) |
3969.00 |
3843.00 - 4158.00 |
2 times |
Fri 17 October 2025 |
2263.00 (0.13%) |
2284.00 |
1770.00 - 2403.00 |
0 times |
Fri 17 October 2025 |
2260.00 (76.7%) |
2284.00 |
1770.00 - 2403.00 |
2 times |
Thu 16 October 2025 |
1279.00 (0%) |
2873.00 |
1109.00 - 2873.00 |
0 times |
Weekly price and charts TotalAdvancing Strong weekly Stock price targets for TotalAdvancing ADVT are 3111 and 3745 | Weekly Target 1 | 2594 | | Weekly Target 2 | 2994 | | Weekly Target 3 | 3228 | | Weekly Target 4 | 3628 | | Weekly Target 5 | 3862 |
Weekly price and volumes for Total Advancing
| Date |
Closing |
Open |
Range |
Volume |
Thu 23 October 2025 |
3394.00 (3.79%) |
3068.00 |
2828.00 - 3462.00 |
0 times |
Thu 23 October 2025 |
3270.00 (81.57%) |
2194.00 |
1357.00 - 3462.00 |
1.1111 times |
Wed 22 October 2025 |
1801.00 (-28.7%) |
1729.00 |
1357.00 - 2870.00 |
1.1111 times |
Tue 21 October 2025 |
2526.00 (-38.09%) |
3969.00 |
1640.00 - 4158.00 |
1.1111 times |
Mon 20 October 2025 |
4080.00 (80.29%) |
3969.00 |
3843.00 - 4158.00 |
1.1111 times |
Fri 17 October 2025 |
2263.00 (0.13%) |
2284.00 |
1770.00 - 2403.00 |
0 times |
Fri 17 October 2025 |
2260.00 (76.7%) |
2873.00 |
1109.00 - 2873.00 |
1.1111 times |
Thu 16 October 2025 |
1279.00 (-54.85%) |
3739.00 |
1109.00 - 4035.00 |
1.1111 times |
Wed 15 October 2025 |
2833.00 (-18.31%) |
907.00 |
907.00 - 4035.00 |
1.1111 times |
Tue 14 October 2025 |
3468.00 (495.88%) |
3884.00 |
907.00 - 3941.00 |
2.2222 times |
Fri 10 October 2025 |
582.00 (-82.1%) |
2880.00 |
575.00 - 3435.00 |
5.5556 times |
Monthly price and charts TotalAdvancing Strong monthly Stock price targets for TotalAdvancing ADVT are 1984.5 and 5567.5 | Monthly Target 1 | -874 | | Monthly Target 2 | 1260 | | Monthly Target 3 | 2709 | | Monthly Target 4 | 4843 | | Monthly Target 5 | 6292 |
Monthly price and volumes Total Advancing
| Date |
Closing |
Open |
Range |
Volume |
Thu 23 October 2025 |
3394.00 (37.35%) |
2216.00 |
575.00 - 4158.00 |
0.8124 times |
Tue 30 September 2025 |
2471.00 (8.14%) |
936.00 |
936.00 - 4031.00 |
1.0662 times |
Fri 29 August 2025 |
2285.00 (46.01%) |
940.00 |
893.00 - 4624.00 |
1.0662 times |
Thu 31 July 2025 |
1565.00 (-43.03%) |
1882.00 |
1054.00 - 3810.00 |
1.0348 times |
Mon 30 June 2025 |
2747.00 (46.35%) |
1562.00 |
858.00 - 4043.00 |
0.9596 times |
Fri 30 May 2025 |
1877.00 (-13.78%) |
2769.00 |
737.00 - 4181.00 |
1.0662 times |
Wed 30 April 2025 |
2177.00 (6.77%) |
1368.00 |
229.00 - 4783.00 |
1.0043 times |
Mon 31 March 2025 |
2039.00 (-39.26%) |
3209.00 |
708.00 - 4278.00 |
0.938 times |
Fri 28 February 2025 |
3357.00 (114.92%) |
512.00 |
512.00 - 3779.00 |
0.9647 times |
Fri 31 January 2025 |
1562.00 (-44.69%) |
3662.00 |
785.00 - 4238.00 |
1.0876 times |
Tue 31 December 2024 |
2824.00 (37.96%) |
1992.00 |
492.00 - 4242.00 |
0.7124 times |
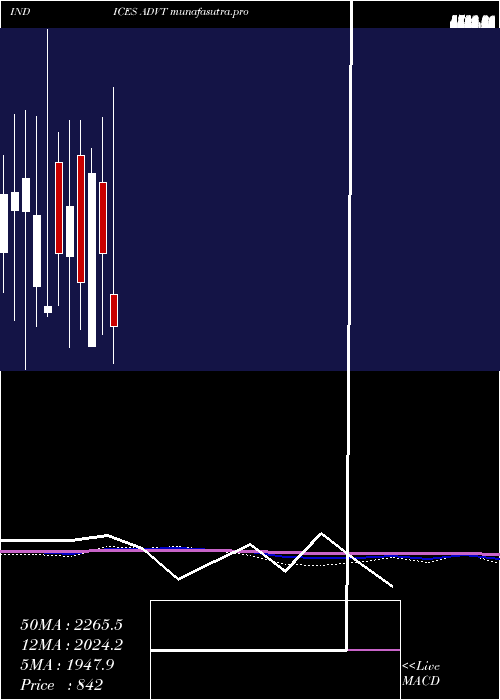
DMA SMA EMA moving averages of Total Advancing ADVT
DMA (daily moving average) of Total Advancing ADVT
| DMA period | DMA value | | 5 day DMA | 2563 | | 12 day DMA | 2549.92 | | 20 day DMA | 2622.15 | | 35 day DMA | 2559.74 | | 50 day DMA | 2551.42 | | 100 day DMA | 2533.57 | | 150 day DMA | 2551.23 | | 200 day DMA | 2542 | EMA (exponential moving average) of Total Advancing ADVT
| EMA period | EMA current | EMA prev | EMA prev2 | | 5 day EMA | 2864.89 | 2600.37 | 2265.6 | | 12 day EMA | 2715.86 | 2592.6 | 2469.48 | | 20 day EMA | 2656.08 | 2578.44 | 2505.68 | | 35 day EMA | 2613.93 | 2568 | 2526.67 | | 50 day EMA | 2562.82 | 2528.91 | 2498.67 |
SMA (simple moving average) of Total Advancing ADVT
| SMA period | SMA current | SMA prev | SMA prev2 | | 5 day SMA | 2563 | 2389.4 | 2554.8 | | 12 day SMA | 2549.92 | 2503.17 | 2466.75 | | 20 day SMA | 2622.15 | 2528.05 | 2496.5 | | 35 day SMA | 2559.74 | 2534.26 | 2485.29 | | 50 day SMA | 2551.42 | 2514.92 | 2540.48 | | 100 day SMA | 2533.57 | 2530.62 | 2528.28 | | 150 day SMA | 2551.23 | 2541.37 | 2544.57 | | 200 day SMA | 2542 | 2538.11 | 2527.49 |
|
|
