TsxAdvancing ADVS full analysis,charts,indicators,moving averages,SMA,DMA,EMA,ADX,MACD,RSITsx Advancing ADVS WideScreen charts, DMA,SMA,EMA technical analysis, forecast prediction, by indicators ADX,MACD,RSI,CCI INDICES stock exchange
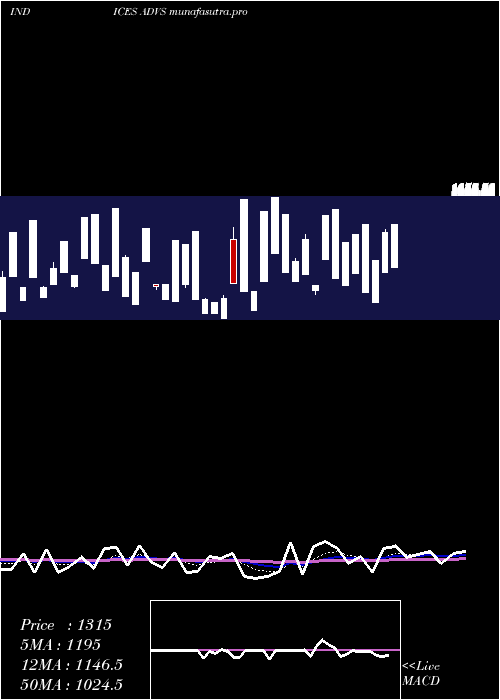
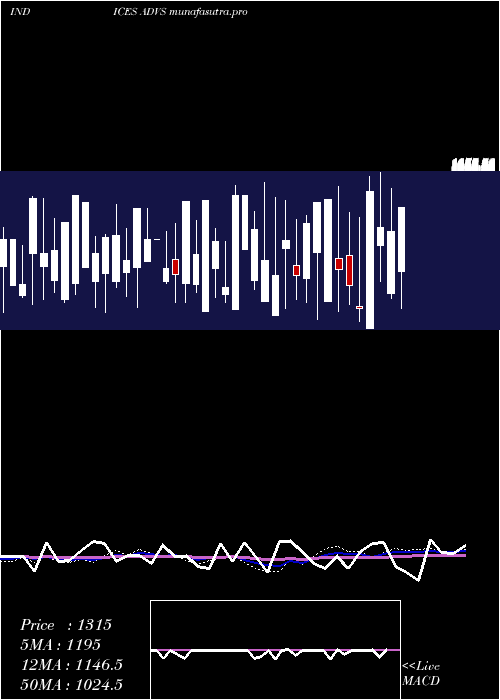
Daily price and charts and targets TsxAdvancing Strong Daily Stock price targets for TsxAdvancing ADVS are 636 and 931 | Daily Target 1 | 399.33 | | Daily Target 2 | 577.67 | | Daily Target 3 | 694.33333333333 | | Daily Target 4 | 872.67 | | Daily Target 5 | 989.33 |
Daily price and volume Tsx Advancing
| Date |
Closing |
Open |
Range |
Volume |
Fri 05 December 2025 |
756.00 (-34.43%) |
516.00 |
516.00 - 811.00 |
0.748 times |
Thu 04 December 2025 |
1153.00 (-14.84%) |
903.00 |
903.00 - 1153.00 |
1.904 times |
Wed 03 December 2025 |
1354.00 (34.46%) |
547.00 |
547.00 - 1354.00 |
0 times |
Tue 02 December 2025 |
1007.00 (35.17%) |
715.00 |
698.00 - 1007.00 |
0.8807 times |
Mon 01 December 2025 |
745.00 (-39.13%) |
477.00 |
445.00 - 746.00 |
1.219 times |
Fri 28 November 2025 |
1224.00 (-20.88%) |
499.00 |
499.00 - 1224.00 |
1.7757 times |
Wed 26 November 2025 |
1547.00 (-1.59%) |
721.00 |
721.00 - 1547.00 |
1.727 times |
Tue 25 November 2025 |
1572.00 (5.93%) |
664.00 |
664.00 - 1572.00 |
1.7457 times |
Mon 24 November 2025 |
1484.00 (5.02%) |
644.00 |
644.00 - 1484.00 |
0 times |
Fri 21 November 2025 |
1413.00 (151.42%) |
454.00 |
454.00 - 1413.00 |
0 times |
Thu 20 November 2025 |
562.00 (-47.82%) |
874.00 |
562.00 - 1234.00 |
0.5379 times |
Weekly price and charts TsxAdvancing Strong weekly Stock price targets for TsxAdvancing ADVS are 600.5 and 1509.5 | Weekly Target 1 | -57.33 | | Weekly Target 2 | 349.33 | | Weekly Target 3 | 851.66666666667 | | Weekly Target 4 | 1258.33 | | Weekly Target 5 | 1760.67 |
Weekly price and volumes for Tsx Advancing
| Date |
Closing |
Open |
Range |
Volume |
Fri 05 December 2025 |
756.00 (-38.24%) |
477.00 |
445.00 - 1354.00 |
0.8332 times |
Fri 28 November 2025 |
1224.00 (-13.38%) |
644.00 |
499.00 - 1572.00 |
0.9203 times |
Fri 21 November 2025 |
1413.00 (92.24%) |
403.00 |
403.00 - 1413.00 |
0.7888 times |
Fri 14 November 2025 |
735.00 (-19.58%) |
717.00 |
120.00 - 1613.00 |
1.3574 times |
Fri 07 November 2025 |
914.00 (-25.93%) |
106.00 |
106.00 - 1517.00 |
0.9245 times |
Fri 31 October 2025 |
1234.00 (0%) |
637.00 |
637.00 - 1235.00 |
0.2781 times |
Fri 31 October 2025 |
1234.00 (-15.31%) |
695.00 |
370.00 - 1251.00 |
1.1396 times |
Fri 24 October 2025 |
1457.00 (76.61%) |
987.00 |
334.00 - 1653.00 |
1.3205 times |
Fri 17 October 2025 |
825.00 (48.11%) |
710.00 |
286.00 - 1590.00 |
1.1513 times |
Fri 10 October 2025 |
557.00 (-61.16%) |
764.00 |
524.00 - 1320.00 |
1.2862 times |
Fri 03 October 2025 |
1434.00 (7.98%) |
747.00 |
457.00 - 1434.00 |
1.2066 times |
Monthly price and charts TsxAdvancing Strong monthly Stock price targets for TsxAdvancing ADVS are 600.5 and 1509.5 | Monthly Target 1 | -57.33 | | Monthly Target 2 | 349.33 | | Monthly Target 3 | 851.66666666667 | | Monthly Target 4 | 1258.33 | | Monthly Target 5 | 1760.67 |
Monthly price and volumes Tsx Advancing
| Date |
Closing |
Open |
Range |
Volume |
Fri 05 December 2025 |
756.00 (-38.24%) |
477.00 |
445.00 - 1354.00 |
0.1845 times |
Fri 28 November 2025 |
1224.00 (-0.81%) |
106.00 |
106.00 - 1613.00 |
0.8839 times |
Fri 31 October 2025 |
1234.00 (2.32%) |
784.00 |
286.00 - 1653.00 |
1.2935 times |
Tue 30 September 2025 |
1206.00 (28.71%) |
257.00 |
257.00 - 1428.00 |
1.3742 times |
Fri 29 August 2025 |
937.00 (20.44%) |
165.00 |
165.00 - 1624.00 |
1.0731 times |
Thu 31 July 2025 |
778.00 (-37.86%) |
645.00 |
386.00 - 1384.00 |
0.913 times |
Mon 30 June 2025 |
1252.00 (64.3%) |
574.00 |
378.00 - 1349.00 |
1.0202 times |
Fri 30 May 2025 |
762.00 (-8.52%) |
675.00 |
292.00 - 1397.00 |
1.1902 times |
Wed 30 April 2025 |
833.00 (-24.07%) |
513.00 |
62.00 - 1679.00 |
1.0312 times |
Mon 31 March 2025 |
1097.00 (-4.36%) |
855.00 |
156.00 - 1534.00 |
1.0362 times |
Fri 28 February 2025 |
1147.00 (50.13%) |
202.00 |
202.00 - 1426.00 |
0.877 times |
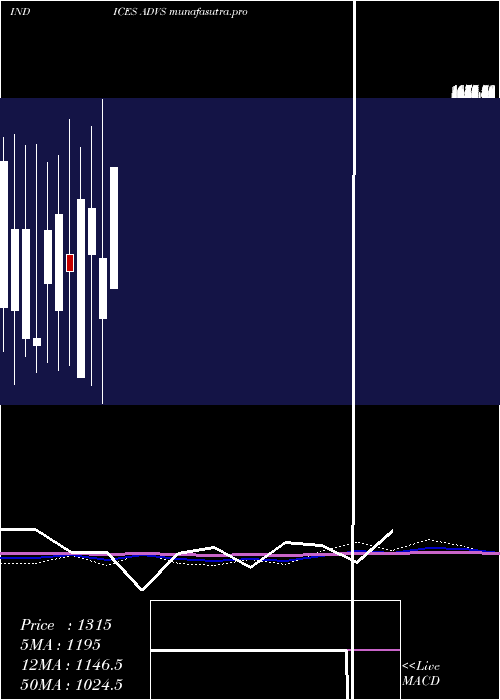
DMA SMA EMA moving averages of Tsx Advancing ADVS
DMA (daily moving average) of Tsx Advancing ADVS
| DMA period | DMA value | | 5 day DMA | 1003 | | 12 day DMA | 1157.83 | | 20 day DMA | 1074.35 | | 35 day DMA | 1074.66 | | 50 day DMA | 1081.6 | | 100 day DMA | 1079.43 | | 150 day DMA | 1080.97 | | 200 day DMA | 1053.55 | EMA (exponential moving average) of Tsx Advancing ADVS
| EMA period | EMA current | EMA prev | EMA prev2 | | 5 day EMA | 1031.89 | 1169.81 | 1178.22 | | 12 day EMA | 1084.9 | 1144.68 | 1143.17 | | 20 day EMA | 1084.12 | 1118.64 | 1115.03 | | 35 day EMA | 1085.99 | 1105.42 | 1102.62 | | 50 day EMA | 1076.55 | 1089.63 | 1087.04 |
SMA (simple moving average) of Tsx Advancing ADVS
| SMA period | SMA current | SMA prev | SMA prev2 | | 5 day SMA | 1003 | 1096.6 | 1175.4 | | 12 day SMA | 1157.83 | 1157.67 | 1105.67 | | 20 day SMA | 1074.35 | 1073.6 | 1091.8 | | 35 day SMA | 1074.66 | 1076.97 | 1083.89 | | 50 day SMA | 1081.6 | 1084.82 | 1087.18 | | 100 day SMA | 1079.43 | 1083.68 | 1079.94 | | 150 day SMA | 1080.97 | 1084.73 | 1084.93 | | 200 day SMA | 1053.55 | 1053.5 | 1054.66 |
|
|
