NasdAdvancing ADVQ full analysis,charts,indicators,moving averages,SMA,DMA,EMA,ADX,MACD,RSINasd Advancing ADVQ WideScreen charts, DMA,SMA,EMA technical analysis, forecast prediction, by indicators ADX,MACD,RSI,CCI INDICES stock exchange
Daily price and charts and targets NasdAdvancing Strong Daily Stock price targets for NasdAdvancing ADVQ are 1786.5 and 2061.5 | Daily Target 1 | 1572.67 | | Daily Target 2 | 1725.33 | | Daily Target 3 | 1847.6666666667 | | Daily Target 4 | 2000.33 | | Daily Target 5 | 2122.67 |
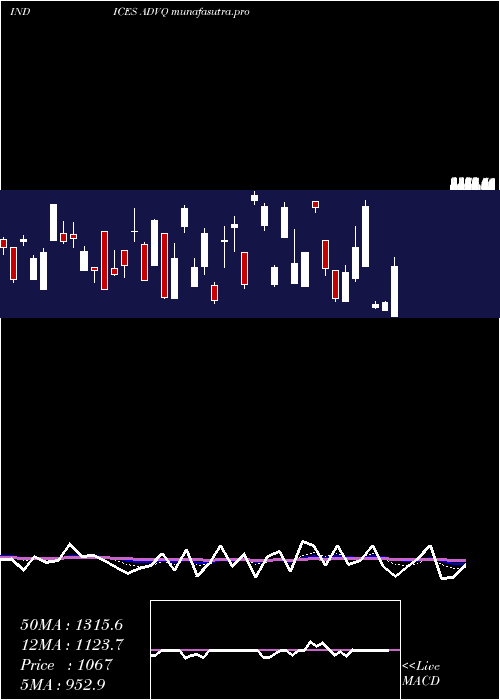
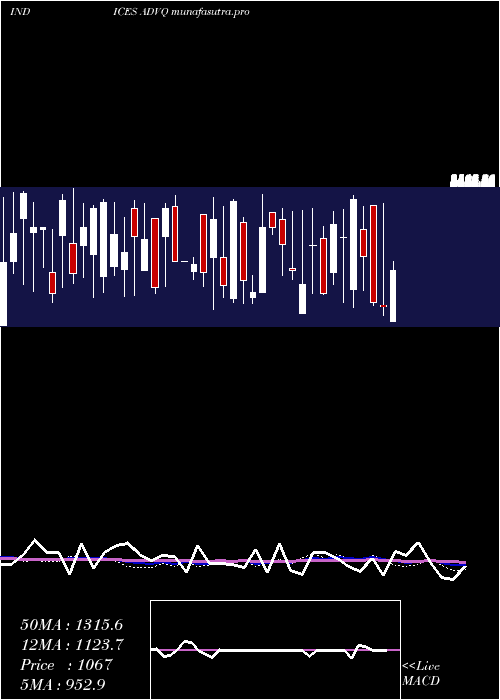
Daily price and volume Nasd Advancing
| Date |
Closing |
Open |
Range |
Volume |
Thu 04 December 2025 |
1878.00 (-18.52%) |
1758.00 |
1695.00 - 1970.00 |
1.4286 times |
Wed 03 December 2025 |
2305.00 (77.58%) |
1616.00 |
1616.00 - 2310.00 |
0 times |
Tue 02 December 2025 |
1298.00 (42.48%) |
1567.00 |
1296.00 - 1567.00 |
1.4286 times |
Mon 01 December 2025 |
911.00 (-53.38%) |
1056.00 |
911.00 - 1215.00 |
1.4286 times |
Fri 28 November 2025 |
1954.00 (0.46%) |
1635.00 |
1635.00 - 1999.00 |
1.4286 times |
Wed 26 November 2025 |
1945.00 (-12.74%) |
1489.00 |
1489.00 - 2206.00 |
1.4286 times |
Tue 25 November 2025 |
2229.00 (7.68%) |
1717.00 |
1717.00 - 2250.00 |
1.4286 times |
Mon 24 November 2025 |
2070.00 (-10.78%) |
1539.00 |
1539.00 - 2130.00 |
0 times |
Fri 21 November 2025 |
2320.00 (202.08%) |
1643.00 |
1608.00 - 2436.00 |
0 times |
Thu 20 November 2025 |
768.00 (-32.75%) |
2282.00 |
766.00 - 2326.00 |
1.4286 times |
Wed 19 November 2025 |
1142.00 (-28.67%) |
1217.00 |
997.00 - 1746.00 |
1.4286 times |
Weekly price and charts NasdAdvancing Strong weekly Stock price targets for NasdAdvancing ADVQ are 1394.5 and 2793.5 | Weekly Target 1 | 300.67 | | Weekly Target 2 | 1089.33 | | Weekly Target 3 | 1699.6666666667 | | Weekly Target 4 | 2488.33 | | Weekly Target 5 | 3098.67 |
Weekly price and volumes for Nasd Advancing
| Date |
Closing |
Open |
Range |
Volume |
Thu 04 December 2025 |
1878.00 (-3.89%) |
1056.00 |
911.00 - 2310.00 |
1.5789 times |
Fri 28 November 2025 |
1954.00 (-15.78%) |
1539.00 |
1489.00 - 2250.00 |
1.5789 times |
Fri 21 November 2025 |
2320.00 (80.4%) |
1133.00 |
738.00 - 2436.00 |
2.1053 times |
Fri 14 November 2025 |
1286.00 (-12.46%) |
1991.00 |
537.00 - 2086.00 |
2.6316 times |
Fri 07 November 2025 |
1469.00 (-9.04%) |
638.00 |
638.00 - 1569.00 |
0 times |
Fri 07 November 2025 |
1615.00 (127.46%) |
1006.00 |
694.00 - 1618.00 |
0.5263 times |
Thu 06 November 2025 |
710.00 (-63.85%) |
1438.00 |
694.00 - 2086.00 |
0.5263 times |
Wed 05 November 2025 |
1964.00 (186.3%) |
414.00 |
414.00 - 2086.00 |
0.5263 times |
Tue 04 November 2025 |
686.00 (-61.91%) |
414.00 |
414.00 - 912.00 |
0.5263 times |
Fri 31 October 2025 |
1801.00 (0%) |
1185.00 |
1185.00 - 1862.00 |
0 times |
Fri 31 October 2025 |
1801.00 (0.22%) |
1185.00 |
1185.00 - 1862.00 |
0 times |
Monthly price and charts NasdAdvancing Strong monthly Stock price targets for NasdAdvancing ADVQ are 1394.5 and 2793.5 | Monthly Target 1 | 300.67 | | Monthly Target 2 | 1089.33 | | Monthly Target 3 | 1699.6666666667 | | Monthly Target 4 | 2488.33 | | Monthly Target 5 | 3098.67 |
Monthly price and volumes Nasd Advancing
| Date |
Closing |
Open |
Range |
Volume |
Thu 04 December 2025 |
1878.00 (-3.89%) |
1056.00 |
911.00 - 2310.00 |
0.1682 times |
Fri 28 November 2025 |
1954.00 (8.5%) |
414.00 |
414.00 - 2436.00 |
0.897 times |
Fri 31 October 2025 |
1801.00 (27.46%) |
1334.00 |
322.00 - 2430.00 |
1.2749 times |
Tue 30 September 2025 |
1413.00 (15.72%) |
646.00 |
646.00 - 2360.00 |
1.1773 times |
Fri 29 August 2025 |
1221.00 (32.86%) |
478.00 |
478.00 - 2669.00 |
1.1773 times |
Thu 31 July 2025 |
919.00 (-43.31%) |
1010.00 |
698.00 - 2322.00 |
1.09 times |
Mon 30 June 2025 |
1621.00 (50.93%) |
1044.00 |
487.00 - 2404.00 |
1.0589 times |
Fri 30 May 2025 |
1074.00 (-18.33%) |
1484.00 |
479.00 - 2442.00 |
1.1773 times |
Wed 30 April 2025 |
1315.00 (37.41%) |
849.00 |
166.00 - 2738.00 |
1.019 times |
Mon 31 March 2025 |
957.00 (-49.34%) |
1655.00 |
412.00 - 2392.00 |
0.9602 times |
Fri 28 February 2025 |
1889.00 (76.87%) |
311.00 |
311.00 - 2161.00 |
1.0599 times |
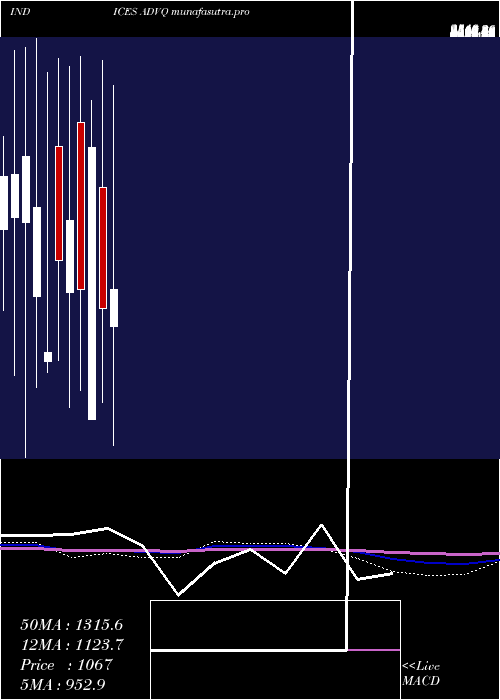
DMA SMA EMA moving averages of Nasd Advancing ADVQ
DMA (daily moving average) of Nasd Advancing ADVQ
| DMA period | DMA value | | 5 day DMA | 1669.2 | | 12 day DMA | 1701.75 | | 20 day DMA | 1564.45 | | 35 day DMA | 1436.77 | | 50 day DMA | 1481.4 | | 100 day DMA | 1487.43 | | 150 day DMA | 1481.41 | | 200 day DMA | 1486.78 | EMA (exponential moving average) of Nasd Advancing ADVQ
| EMA period | EMA current | EMA prev | EMA prev2 | | 5 day EMA | 1798.18 | 1758.27 | 1484.94 | | 12 day EMA | 1686.01 | 1651.12 | 1532.27 | | 20 day EMA | 1606.35 | 1577.77 | 1501.25 | | 35 day EMA | 1550.82 | 1531.56 | 1486.03 | | 50 day EMA | 1492.49 | 1476.76 | 1442.97 |
SMA (simple moving average) of Nasd Advancing ADVQ
| SMA period | SMA current | SMA prev | SMA prev2 | | 5 day SMA | 1669.2 | 1682.6 | 1667.4 | | 12 day SMA | 1701.75 | 1608.75 | 1523.83 | | 20 day SMA | 1564.45 | 1506.15 | 1426.4 | | 35 day SMA | 1436.77 | 1414.94 | 1392.2 | | 50 day SMA | 1481.4 | 1458.8 | 1427.66 | | 100 day SMA | 1487.43 | 1482.25 | 1474.7 | | 150 day SMA | 1481.41 | 1483.39 | 1475.47 | | 200 day SMA | 1486.78 | 1485.04 | 1475.77 |
|
|
