EtfsAdvancing ADVE full analysis,charts,indicators,moving averages,SMA,DMA,EMA,ADX,MACD,RSIEtfs Advancing ADVE WideScreen charts, DMA,SMA,EMA technical analysis, forecast prediction, by indicators ADX,MACD,RSI,CCI INDICES stock exchange
Daily price and charts and targets EtfsAdvancing Strong Daily Stock price targets for EtfsAdvancing ADVE are 2110.5 and 2789.5 | Daily Target 1 | 1544.67 | | Daily Target 2 | 1997.33 | | Daily Target 3 | 2223.6666666667 | | Daily Target 4 | 2676.33 | | Daily Target 5 | 2902.67 |
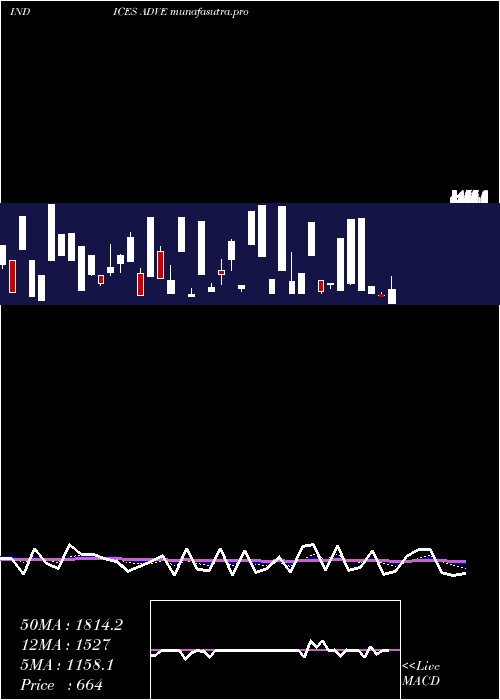
Daily price and volume Etfs Advancing
| Date |
Closing |
Open |
Range |
Volume |
Thu 04 December 2025 |
2450.00 (-35.24%) |
1771.00 |
1771.00 - 2450.00 |
1.3226 times |
Wed 03 December 2025 |
3783.00 (26.9%) |
1625.00 |
1625.00 - 3783.00 |
0 times |
Tue 02 December 2025 |
2981.00 (280.23%) |
2388.00 |
2162.00 - 2983.00 |
1.6768 times |
Mon 01 December 2025 |
784.00 (-78.09%) |
802.00 |
717.00 - 1395.00 |
0.8154 times |
Fri 28 November 2025 |
3578.00 (-12.26%) |
1867.00 |
1867.00 - 3581.00 |
1.1548 times |
Wed 26 November 2025 |
4078.00 (4.7%) |
1942.00 |
1942.00 - 4078.00 |
1.6768 times |
Tue 25 November 2025 |
3895.00 (10.37%) |
1560.00 |
1560.00 - 3896.00 |
1.6768 times |
Mon 24 November 2025 |
3529.00 (-5.46%) |
2005.00 |
2005.00 - 3529.00 |
0 times |
Fri 21 November 2025 |
3733.00 (352.48%) |
1829.00 |
1829.00 - 3734.00 |
0 times |
Thu 20 November 2025 |
825.00 (-59.91%) |
2400.00 |
825.00 - 3228.00 |
1.6768 times |
Wed 19 November 2025 |
2058.00 (11.12%) |
1389.00 |
1389.00 - 2274.00 |
1.3715 times |
Weekly price and charts EtfsAdvancing Strong weekly Stock price targets for EtfsAdvancing ADVE are 1583.5 and 4649.5 | Weekly Target 1 | -749.33 | | Weekly Target 2 | 850.33 | | Weekly Target 3 | 2316.6666666667 | | Weekly Target 4 | 3916.33 | | Weekly Target 5 | 5382.67 |
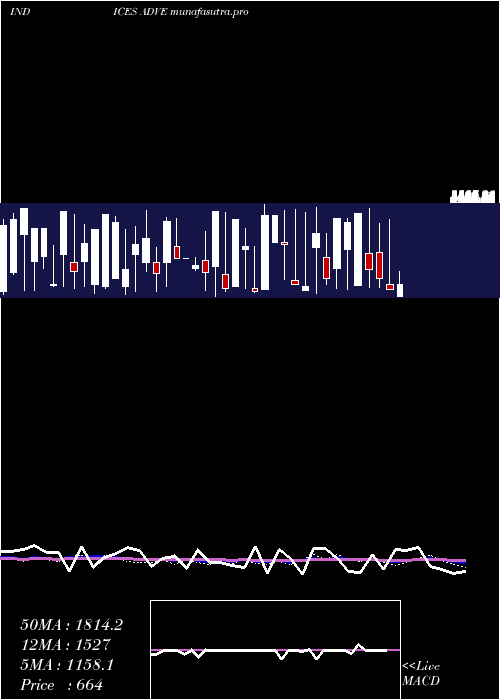
Weekly price and volumes for Etfs Advancing
| Date |
Closing |
Open |
Range |
Volume |
Thu 04 December 2025 |
2450.00 (-31.53%) |
802.00 |
717.00 - 3783.00 |
1.3392 times |
Fri 28 November 2025 |
3578.00 (-4.15%) |
2005.00 |
1560.00 - 4078.00 |
1.5828 times |
Fri 21 November 2025 |
3733.00 (121.15%) |
1069.00 |
794.00 - 3734.00 |
2.164 times |
Fri 14 November 2025 |
1688.00 (-15.56%) |
2204.00 |
397.00 - 3820.00 |
2.6189 times |
Fri 07 November 2025 |
1999.00 (-31.91%) |
503.00 |
503.00 - 2005.00 |
0 times |
Fri 07 November 2025 |
2936.00 (127.77%) |
1387.00 |
698.00 - 2937.00 |
0.5887 times |
Thu 06 November 2025 |
1289.00 (-61.81%) |
1502.00 |
1101.00 - 3114.00 |
0.5667 times |
Wed 05 November 2025 |
3375.00 (245.8%) |
448.00 |
448.00 - 3377.00 |
0.5887 times |
Tue 04 November 2025 |
976.00 (-65.89%) |
448.00 |
448.00 - 981.00 |
0.551 times |
Fri 31 October 2025 |
2861.00 (0%) |
1579.00 |
1579.00 - 2861.00 |
0 times |
Fri 31 October 2025 |
2861.00 (0.1%) |
1579.00 |
1579.00 - 2861.00 |
0 times |
Monthly price and charts EtfsAdvancing Strong monthly Stock price targets for EtfsAdvancing ADVE are 1583.5 and 4649.5 | Monthly Target 1 | -749.33 | | Monthly Target 2 | 850.33 | | Monthly Target 3 | 2316.6666666667 | | Monthly Target 4 | 3916.33 | | Monthly Target 5 | 5382.67 |
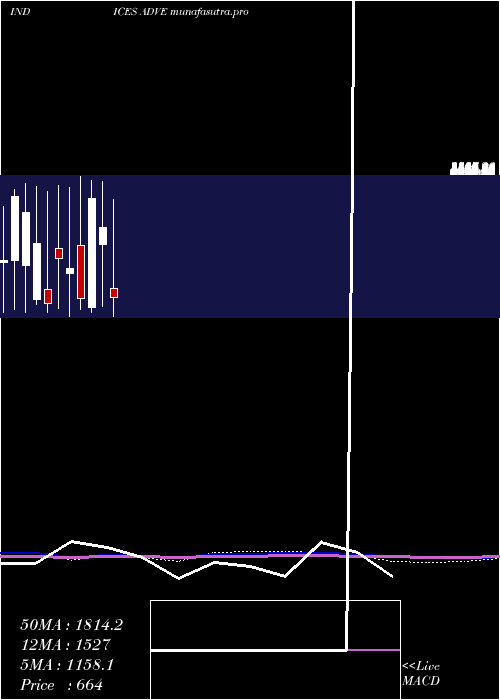
Monthly price and volumes Etfs Advancing
| Date |
Closing |
Open |
Range |
Volume |
Thu 04 December 2025 |
2450.00 (-31.53%) |
802.00 |
717.00 - 3783.00 |
0.151 times |
Fri 28 November 2025 |
3578.00 (25.06%) |
448.00 |
397.00 - 4078.00 |
0.9766 times |
Fri 31 October 2025 |
2861.00 (-5.08%) |
1544.00 |
375.00 - 4038.00 |
1.4158 times |
Tue 30 September 2025 |
3014.00 (160.05%) |
380.00 |
380.00 - 3956.00 |
1.1781 times |
Fri 29 August 2025 |
1159.00 (1.31%) |
669.00 |
369.00 - 4127.00 |
1.0363 times |
Thu 31 July 2025 |
1144.00 (-67%) |
865.00 |
412.00 - 3533.00 |
1.085 times |
Mon 30 June 2025 |
3467.00 (58.89%) |
901.00 |
375.00 - 3695.00 |
1.0162 times |
Fri 30 May 2025 |
2182.00 (7.12%) |
1911.00 |
457.00 - 3504.00 |
1.0632 times |
Wed 30 April 2025 |
2037.00 (-13.43%) |
885.00 |
220.00 - 3706.00 |
1.1469 times |
Mon 31 March 2025 |
2353.00 (-22.9%) |
1928.00 |
462.00 - 3446.00 |
0.9306 times |
Fri 28 February 2025 |
3052.00 (376.88%) |
426.00 |
312.00 - 3483.00 |
0.8221 times |
DMA SMA EMA moving averages of Etfs Advancing ADVE
DMA (daily moving average) of Etfs Advancing ADVE
| DMA period | DMA value | | 5 day DMA | 2715.2 | | 12 day DMA | 2795.5 | | 20 day DMA | 2538.15 | | 35 day DMA | 2258.83 | | 50 day DMA | 2420.94 | | 100 day DMA | 2408.01 | | 150 day DMA | 2369.29 | | 200 day DMA | 2316.1 | EMA (exponential moving average) of Etfs Advancing ADVE
| EMA period | EMA current | EMA prev | EMA prev2 | | 5 day EMA | 2860.13 | 3065.16 | 2706.29 | | 12 day EMA | 2753.57 | 2808.74 | 2631.66 | | 20 day EMA | 2616.73 | 2634.27 | 2513.41 | | 35 day EMA | 2543.63 | 2549.14 | 2476.5 | | 50 day EMA | 2457.29 | 2457.59 | 2403.51 |
SMA (simple moving average) of Etfs Advancing ADVE
| SMA period | SMA current | SMA prev | SMA prev2 | | 5 day SMA | 2715.2 | 3040.8 | 3063.2 | | 12 day SMA | 2795.5 | 2657.58 | 2483 | | 20 day SMA | 2538.15 | 2480.2 | 2355.5 | | 35 day SMA | 2258.83 | 2241.63 | 2226.23 | | 50 day SMA | 2420.94 | 2404.36 | 2361.12 | | 100 day SMA | 2408.01 | 2397.37 | 2388.04 | | 150 day SMA | 2369.29 | 2376.32 | 2362.12 | | 200 day SMA | 2316.1 | 2309.74 | 2294.52 |
|
|
