AmexAdvancing ADVA full analysis,charts,indicators,moving averages,SMA,DMA,EMA,ADX,MACD,RSIAmex Advancing ADVA WideScreen charts, DMA,SMA,EMA technical analysis, forecast prediction, by indicators ADX,MACD,RSI,CCI INDICES stock exchange
Daily price and charts and targets AmexAdvancing Strong Daily Stock price targets for AmexAdvancing ADVA are 54 and 76 | Daily Target 1 | 36 | | Daily Target 2 | 50 | | Daily Target 3 | 58 | | Daily Target 4 | 72 | | Daily Target 5 | 80 |
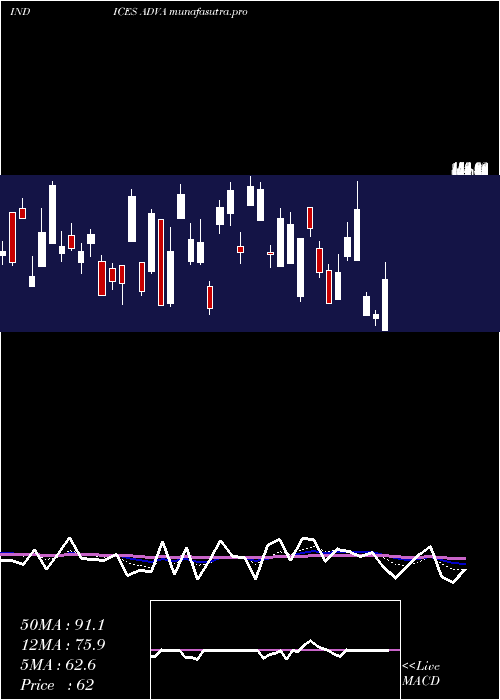
Daily price and volume Amex Advancing
| Date |
Closing |
Open |
Range |
Volume |
Tue 21 October 2025 |
64.00 (3.23%) |
58.00 |
44.00 - 66.00 |
0 times |
Tue 21 October 2025 |
62.00 (-60%) |
58.00 |
44.00 - 66.00 |
0.2705 times |
Mon 20 October 2025 |
155.00 (-1.27%) |
150.00 |
145.00 - 160.00 |
0 times |
Mon 20 October 2025 |
157.00 (248.89%) |
150.00 |
145.00 - 160.00 |
3.4416 times |
Fri 17 October 2025 |
45.00 (0%) |
56.00 |
36.00 - 56.00 |
0 times |
Fri 17 October 2025 |
45.00 (7.14%) |
56.00 |
36.00 - 56.00 |
0.6059 times |
Thu 16 October 2025 |
42.00 (0%) |
108.00 |
38.00 - 108.00 |
0 times |
Thu 16 October 2025 |
42.00 (-62.5%) |
108.00 |
38.00 - 108.00 |
2.5745 times |
Wed 15 October 2025 |
112.00 (0%) |
142.00 |
105.00 - 149.00 |
0 times |
Wed 15 October 2025 |
112.00 (0%) |
137.00 |
105.00 - 149.00 |
3.1074 times |
Tue 14 October 2025 |
112.00 (0%) |
41.00 |
41.00 - 128.00 |
0 times |
Weekly price and charts AmexAdvancing Strong weekly Stock price targets for AmexAdvancing ADVA are 54 and 76 | Weekly Target 1 | 36 | | Weekly Target 2 | 50 | | Weekly Target 3 | 58 | | Weekly Target 4 | 72 | | Weekly Target 5 | 80 |
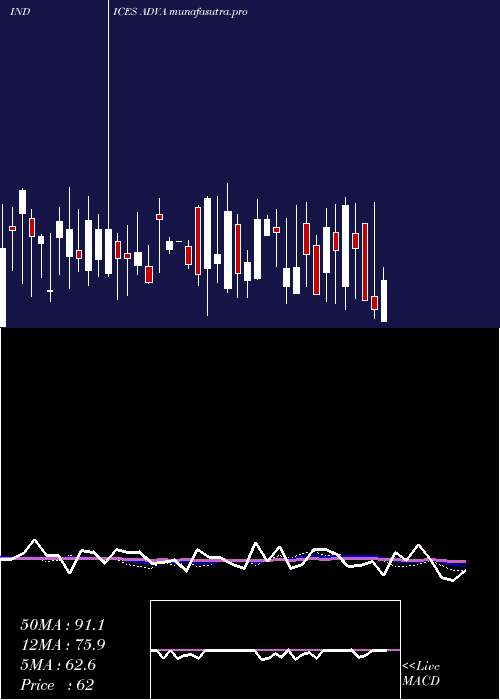
Weekly price and volumes for Amex Advancing
| Date |
Closing |
Open |
Range |
Volume |
Tue 21 October 2025 |
64.00 (3.23%) |
58.00 |
44.00 - 66.00 |
0 times |
Tue 21 October 2025 |
62.00 (-60.51%) |
150.00 |
44.00 - 160.00 |
0.0378 times |
Mon 20 October 2025 |
157.00 (248.89%) |
150.00 |
145.00 - 160.00 |
0.4813 times |
Fri 17 October 2025 |
45.00 (0%) |
56.00 |
36.00 - 56.00 |
0 times |
Fri 17 October 2025 |
45.00 (7.14%) |
108.00 |
36.00 - 108.00 |
0.0847 times |
Thu 16 October 2025 |
42.00 (-62.5%) |
142.00 |
38.00 - 149.00 |
0.36 times |
Wed 15 October 2025 |
112.00 (0%) |
41.00 |
41.00 - 149.00 |
0.4345 times |
Tue 14 October 2025 |
112.00 (138.3%) |
152.00 |
41.00 - 153.00 |
1.3457 times |
Fri 10 October 2025 |
47.00 (-67.59%) |
138.00 |
37.00 - 148.00 |
4.8094 times |
Fri 03 October 2025 |
145.00 (9.02%) |
125.00 |
58.00 - 161.00 |
2.4466 times |
Fri 26 September 2025 |
133.00 (8.13%) |
86.00 |
57.00 - 144.00 |
2.0038 times |
Monthly price and charts AmexAdvancing Strong monthly Stock price targets for AmexAdvancing ADVA are -12.5 and 112.5 | Monthly Target 1 | -38 | | Monthly Target 2 | 13 | | Monthly Target 3 | 87 | | Monthly Target 4 | 138 | | Monthly Target 5 | 212 |
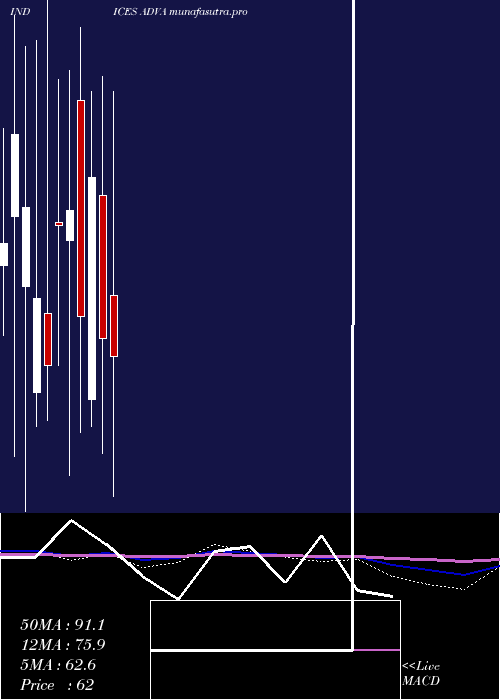
Monthly price and volumes Amex Advancing
| Date |
Closing |
Open |
Range |
Volume |
Tue 21 October 2025 |
64.00 (-7.25%) |
113.00 |
36.00 - 161.00 |
1.6899 times |
Tue 30 September 2025 |
69.00 (-34.29%) |
86.00 |
51.00 - 156.00 |
1.421 times |
Fri 29 August 2025 |
105.00 (45.83%) |
45.00 |
45.00 - 180.00 |
0.9544 times |
Thu 31 July 2025 |
72.00 (-35.71%) |
84.00 |
50.00 - 156.00 |
1.0217 times |
Mon 30 June 2025 |
112.00 (40%) |
125.00 |
56.00 - 151.00 |
1.3795 times |
Fri 30 May 2025 |
80.00 (9.59%) |
91.00 |
48.00 - 129.00 |
1.0154 times |
Wed 30 April 2025 |
73.00 (7.35%) |
82.00 |
16.00 - 185.00 |
0.5398 times |
Mon 31 March 2025 |
68.00 (-43.8%) |
115.00 |
30.00 - 154.00 |
0.4859 times |
Fri 28 February 2025 |
121.00 (61.33%) |
48.00 |
39.00 - 149.00 |
0.6273 times |
Fri 31 January 2025 |
75.00 (-31.82%) |
146.00 |
37.00 - 170.00 |
0.8651 times |
Tue 31 December 2024 |
110.00 (4.76%) |
100.00 |
23.00 - 156.00 |
0.6096 times |
DMA SMA EMA moving averages of Amex Advancing ADVA
DMA (daily moving average) of Amex Advancing ADVA
| DMA period | DMA value | | 5 day DMA | 96.6 | | 12 day DMA | 88.33 | | 20 day DMA | 96.25 | | 35 day DMA | 100.34 | | 50 day DMA | 103.92 | | 100 day DMA | 102.83 | | 150 day DMA | 102.27 | | 200 day DMA | 101.73 | EMA (exponential moving average) of Amex Advancing ADVA
| EMA period | EMA current | EMA prev | EMA prev2 | | 5 day EMA | 84.86 | 95.29 | 111.94 | | 12 day EMA | 88.82 | 93.33 | 99.03 | | 20 day EMA | 92.37 | 95.36 | 98.87 | | 35 day EMA | 97.25 | 99.21 | 101.4 | | 50 day EMA | 102.42 | 103.99 | 105.7 |
SMA (simple moving average) of Amex Advancing ADVA
| SMA period | SMA current | SMA prev | SMA prev2 | | 5 day SMA | 96.6 | 92.8 | 88.8 | | 12 day SMA | 88.33 | 95 | 93.75 | | 20 day SMA | 96.25 | 96.5 | 98.45 | | 35 day SMA | 100.34 | 101.69 | 103.2 | | 50 day SMA | 103.92 | 103.58 | 104.58 | | 100 day SMA | 102.83 | 103.39 | 104.05 | | 150 day SMA | 102.27 | 102.5 | 102.83 | | 200 day SMA | 101.73 | 101.76 | 101.8 |
|
|
