GoldGuinea GOLDGUINEA full analysis,charts,indicators,moving averages,SMA,DMA,EMA,ADX,MACD,RSIGold Guinea GOLDGUINEA WideScreen charts, DMA,SMA,EMA technical analysis, forecast prediction, by indicators ADX,MACD,RSI,CCI COMMODITY stock exchange
operates under BULLION sector
Daily price and charts and targets GoldGuinea Strong Daily Stock price targets for GoldGuinea GOLDGUINEA are 98562 and 100960 | Daily Target 1 | 96610 | | Daily Target 2 | 98116 | | Daily Target 3 | 99008 | | Daily Target 4 | 100514 | | Daily Target 5 | 101406 |
Daily price and volume Gold Guinea
| Date |
Closing |
Open |
Range |
Volume |
Thu 23 October 2025 |
99622.00 (-3.16%) |
97502.00 |
97502.00 - 99900.00 |
0.5041 times |
Tue 21 October 2025 |
102870.00 (-1.41%) |
102528.00 |
102327.00 - 103836.00 |
0.1231 times |
Mon 20 October 2025 |
104337.00 (2.28%) |
102998.00 |
101090.00 - 104550.00 |
1.0334 times |
Fri 17 October 2025 |
102013.00 (-2.26%) |
104650.00 |
100111.00 - 106848.00 |
1.7276 times |
Thu 16 October 2025 |
104376.00 (2.71%) |
103251.00 |
102900.00 - 104554.00 |
0.8397 times |
Tue 14 October 2025 |
101618.00 (1.7%) |
100374.00 |
99547.00 - 102050.00 |
1.2645 times |
Mon 13 October 2025 |
99916.00 (2.26%) |
98824.00 |
98708.00 - 99993.00 |
0.9012 times |
Fri 10 October 2025 |
97708.00 (0.48%) |
98489.00 |
96310.00 - 98489.00 |
1.2339 times |
Thu 09 October 2025 |
97241.00 (-2.15%) |
99400.00 |
96600.00 - 99900.00 |
1.4437 times |
Wed 08 October 2025 |
99377.00 (2.2%) |
97699.00 |
97555.00 - 99925.00 |
0.9288 times |
Tue 07 October 2025 |
97237.00 (0.87%) |
96494.00 |
96353.00 - 97490.00 |
0.8794 times |
Weekly price and charts GoldGuinea Strong weekly Stock price targets for GoldGuinea GOLDGUINEA are 95038 and 102086 | Weekly Target 1 | 93510 | | Weekly Target 2 | 96566 | | Weekly Target 3 | 100558 | | Weekly Target 4 | 103614 | | Weekly Target 5 | 107606 |
Weekly price and volumes for Gold Guinea
| Date |
Closing |
Open |
Range |
Volume |
Thu 23 October 2025 |
99622.00 (-2.34%) |
102998.00 |
97502.00 - 104550.00 |
0.709 times |
Fri 17 October 2025 |
102013.00 (4.41%) |
98824.00 |
98708.00 - 106848.00 |
2.021 times |
Fri 10 October 2025 |
97708.00 (3.16%) |
95179.00 |
95127.00 - 99925.00 |
2.2387 times |
Fri 03 October 2025 |
94711.00 (3.61%) |
92323.00 |
92313.00 - 94955.00 |
0.7188 times |
Fri 26 September 2025 |
91409.00 (3.76%) |
88497.00 |
88300.00 - 93980.00 |
0.4155 times |
Fri 19 September 2025 |
88098.00 (0.49%) |
89970.00 |
87150.00 - 89970.00 |
0.8231 times |
Fri 12 September 2025 |
87669.00 (1.43%) |
86224.00 |
85555.00 - 87999.00 |
1.1111 times |
Fri 05 September 2025 |
86434.00 (5.53%) |
83999.00 |
83513.00 - 86699.00 |
1.2881 times |
Fri 29 August 2025 |
81902.00 (2.3%) |
80061.00 |
79872.00 - 83275.00 |
0.0611 times |
Fri 22 August 2025 |
80059.00 (0.12%) |
80299.00 |
79013.00 - 80299.00 |
0.6136 times |
Thu 14 August 2025 |
79965.00 (-1.63%) |
80987.00 |
79823.00 - 81000.00 |
0.6435 times |
Monthly price and charts GoldGuinea Strong monthly Stock price targets for GoldGuinea GOLDGUINEA are 96738.5 and 109731.5 | Monthly Target 1 | 87115.33 | | Monthly Target 2 | 93368.67 | | Monthly Target 3 | 100108.33333333 | | Monthly Target 4 | 106361.67 | | Monthly Target 5 | 113101.33 |
Monthly price and volumes Gold Guinea
| Date |
Closing |
Open |
Range |
Volume |
Thu 23 October 2025 |
99622.00 (8.08%) |
94299.00 |
93855.00 - 106848.00 |
2.1427 times |
Tue 30 September 2025 |
92178.00 (12.55%) |
83999.00 |
83513.00 - 94106.00 |
1.3747 times |
Fri 29 August 2025 |
81902.00 (3.98%) |
79208.00 |
78830.00 - 83275.00 |
0.9188 times |
Thu 31 July 2025 |
78770.00 (2.5%) |
77779.00 |
77368.00 - 80588.00 |
0.8878 times |
Mon 30 June 2025 |
76849.00 (0.65%) |
77194.00 |
76699.00 - 80200.00 |
0.9693 times |
Fri 30 May 2025 |
76352.00 (1.2%) |
75512.00 |
73630.00 - 78598.00 |
1.3578 times |
Wed 30 April 2025 |
75444.00 (4.15%) |
72759.00 |
70450.00 - 79498.00 |
0.8488 times |
Mon 31 March 2025 |
72438.00 (6.36%) |
69055.00 |
68750.00 - 72575.00 |
0.526 times |
Fri 28 February 2025 |
68104.00 (3.66%) |
65688.00 |
65517.00 - 70880.00 |
0.5504 times |
Fri 31 January 2025 |
65701.00 (7.75%) |
62052.00 |
61925.00 - 66176.00 |
0.4237 times |
Tue 31 December 2024 |
60975.00 (-0.64%) |
61699.00 |
60231.00 - 63200.00 |
0.5138 times |
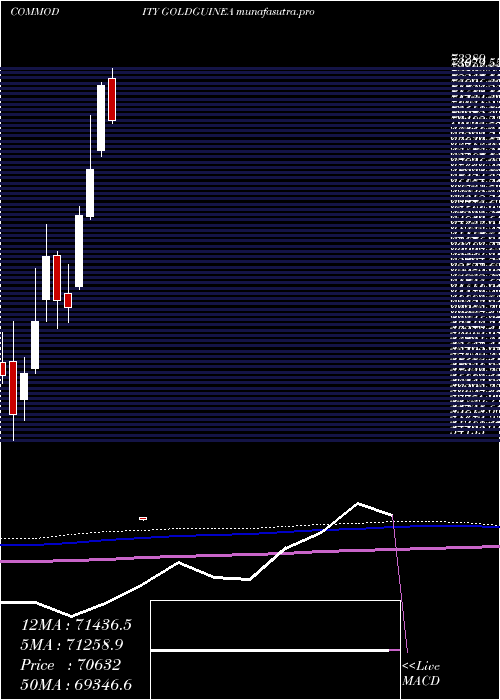
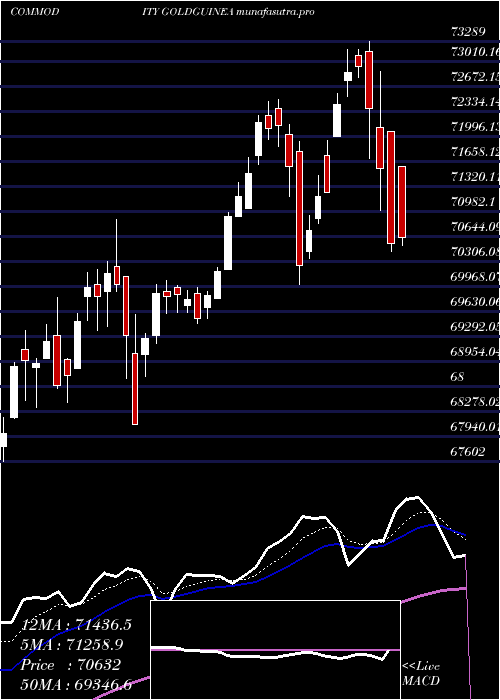
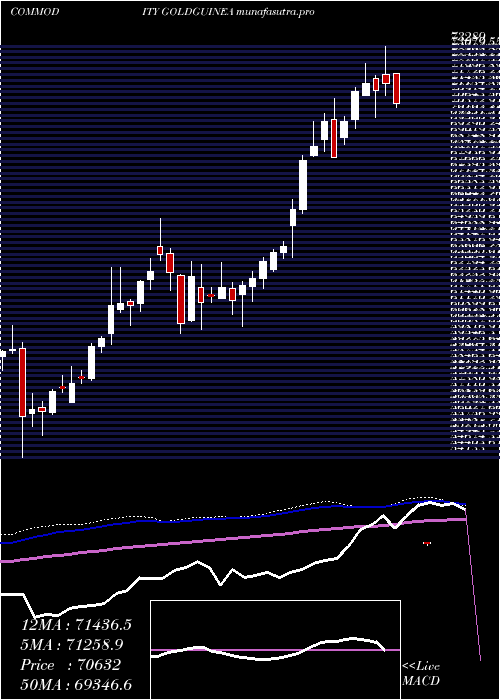
DMA SMA EMA moving averages of Gold Guinea GOLDGUINEA
DMA (daily moving average) of Gold Guinea GOLDGUINEA
| DMA period | DMA value | | 5 day DMA | 102643.6 | | 12 day DMA | 100226.42 | | 20 day DMA | 97104.9 | | 35 day DMA | 92911.03 | | 50 day DMA | 89227.52 | | 100 day DMA | 84019.37 | | 150 day DMA | 80936.81 | | 200 day DMA | 77470.91 | EMA (exponential moving average) of Gold Guinea GOLDGUINEA
| EMA period | EMA current | EMA prev | EMA prev2 | | 5 day EMA | 101542.41 | 102502.47 | 102318.74 | | 12 day EMA | 99867.72 | 99912.38 | 99374.82 | | 20 day EMA | 97519.89 | 97298.71 | 96712.52 | | 35 day EMA | 93684.79 | 93335.25 | 92773.91 | | 50 day EMA | 89865.66 | 89467.61 | 88920.8 |
SMA (simple moving average) of Gold Guinea GOLDGUINEA
| SMA period | SMA current | SMA prev | SMA prev2 | | 5 day SMA | 102643.6 | 103042.8 | 102452 | | 12 day SMA | 100226.42 | 99817.17 | 99121.08 | | 20 day SMA | 97104.9 | 96611.75 | 95873.15 | | 35 day SMA | 92911.03 | 92465.74 | 91866.66 | | 50 day SMA | 89227.52 | 88860.82 | 88422.66 | | 100 day SMA | 84019.37 | 83786.67 | 83525.95 | | 150 day SMA | 80936.81 | 80753.85 | 80544.69 | | 200 day SMA | 77470.91 | 77285.12 | 77083.83 |
Futures expiry: 31 Fri October 2025
| Date | Closing | Open | Range | Volume | | 23 Thu |
99622.00 |
97502.00 |
97502.00 to 99900.00 |
0.6 times |
| 21 Tue |
102870.00 |
102528.00 |
102327.00 to 103836.00 |
0.15 times |
| 20 Mon |
104337.00 |
102998.00 |
101090.00 to 104550.00 |
1.22 times |
| 17 Fri |
102013.00 |
104650.00 |
100111.00 to 106848.00 |
2.04 times |
| 16 Thu |
104376.00 |
103251.00 |
102900.00 to 104554.00 |
0.99 times |
Futures expiry: 28 Fri November 2025
| Date | Closing | Open | Range | Volume | | 23 Thu |
100021.00 |
98169.00 |
98169.00 to 100398.00 |
0.97 times |
| 21 Tue |
103702.00 |
104923.00 |
103101.00 to 104924.00 |
0.17 times |
| 20 Mon |
105136.00 |
103423.00 |
101820.00 to 105500.00 |
1.29 times |
| 17 Fri |
102759.00 |
105426.00 |
101911.00 to 107400.00 |
1.74 times |
| 16 Thu |
105062.00 |
103327.00 |
103300.00 to 106068.00 |
0.83 times |
Futures expiry: 31 Wed December 2025
| Date | Closing | Open | Range | Volume | | 23 Thu |
100667.00 |
99499.00 |
99011.00 to 101000.00 |
0.66 times |
| 21 Tue |
104593.00 |
105712.00 |
103372.00 to 105713.00 |
0.2 times |
| 20 Mon |
105974.00 |
104127.00 |
102634.00 to 106400.00 |
1.14 times |
| 17 Fri |
103605.00 |
106000.00 |
102549.00 to 108100.00 |
1.93 times |
| 16 Thu |
105720.00 |
103899.00 |
103899.00 to 106666.00 |
1.06 times |
|
|
