Msfl0 977093 full analysis,charts,indicators,moving averages,SMA,DMA,EMA,ADX,MACD,RSIMsfl 0 977093 WideScreen charts, DMA,SMA,EMA technical analysis, forecast prediction, by indicators ADX,MACD,RSI,CCI BSE stock exchange
Daily price and charts and targets Msfl0 Strong Daily Stock price targets for Msfl0 977093 are 102410 and 102410 | Daily Target 1 | 102410 | | Daily Target 2 | 102410 | | Daily Target 3 | 102410 | | Daily Target 4 | 102410 | | Daily Target 5 | 102410 |
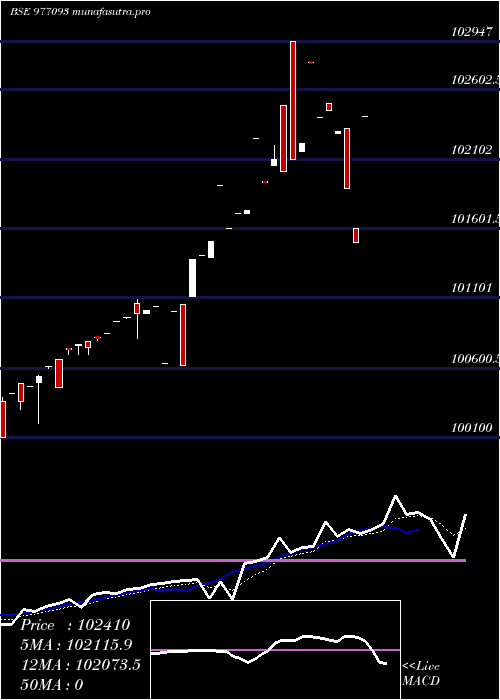
Daily price and volume Msfl 0
| Date |
Closing |
Open |
Range |
Volume |
Fri 05 December 2025 |
102410.00 (0.9%) |
102410.00 |
102410.00 - 102410.00 |
0.5405 times |
Wed 03 December 2025 |
101500.00 (-0.39%) |
101600.00 |
101500.00 - 101600.00 |
0.0772 times |
Tue 02 December 2025 |
101900.00 (-0.39%) |
102324.00 |
101900.00 - 102324.00 |
0.5405 times |
Mon 01 December 2025 |
102300.00 (-0.15%) |
102296.00 |
102296.00 - 102300.00 |
0.1158 times |
Fri 28 November 2025 |
102451.10 (0.05%) |
102501.00 |
102451.10 - 102501.00 |
0.1931 times |
Thu 27 November 2025 |
102400.00 (-0.39%) |
102400.00 |
102400.00 - 102400.00 |
0.0386 times |
Wed 26 November 2025 |
102800.00 (0.57%) |
102800.01 |
102800.00 - 102800.01 |
0.0772 times |
Tue 25 November 2025 |
102220.00 (0.12%) |
102160.00 |
102160.00 - 102220.00 |
0.2317 times |
Mon 24 November 2025 |
102100.00 (0.08%) |
102947.00 |
102100.00 - 102947.00 |
0.1544 times |
Fri 21 November 2025 |
102017.00 (-0.08%) |
102500.00 |
102017.00 - 102500.00 |
8.0309 times |
Thu 20 November 2025 |
102100.00 (0.16%) |
102060.00 |
102060.00 - 102201.00 |
0.1931 times |
Weekly price and charts Msfl0 Strong weekly Stock price targets for Msfl0 977093 are 101955 and 102865 | Weekly Target 1 | 101196.67 | | Weekly Target 2 | 101803.33 | | Weekly Target 3 | 102106.66666667 | | Weekly Target 4 | 102713.33 | | Weekly Target 5 | 103016.67 |
Weekly price and volumes for Msfl 0
| Date |
Closing |
Open |
Range |
Volume |
Fri 05 December 2025 |
102410.00 (-0.04%) |
102296.00 |
101500.00 - 102410.00 |
0.0637 times |
Fri 28 November 2025 |
102451.10 (0.43%) |
102947.00 |
102100.00 - 102947.00 |
0.0347 times |
Fri 21 November 2025 |
102017.00 (-0.23%) |
101950.00 |
101933.00 - 102500.00 |
0.5096 times |
Wed 12 November 2025 |
102250.00 (0.64%) |
101710.00 |
101710.00 - 102250.00 |
0.0347 times |
Thu 06 November 2025 |
101599.00 (0.19%) |
101401.00 |
101401.00 - 101916.00 |
0.0869 times |
Thu 30 October 2025 |
101405.00 (0.4%) |
101050.00 |
100622.00 - 101405.00 |
0.2683 times |
Thu 23 October 2025 |
100999.99 (-0.04%) |
100631.00 |
100631.00 - 100999.99 |
0.0039 times |
Fri 17 October 2025 |
101045.00 (0.19%) |
100934.00 |
100810.00 - 101100.00 |
4.5377 times |
Fri 10 October 2025 |
100852.00 (0.4%) |
100741.00 |
100699.00 - 100852.00 |
1.0809 times |
Fri 03 October 2025 |
100455.00 (-0.01%) |
100499.00 |
100200.00 - 100660.00 |
3.3797 times |
Fri 26 September 2025 |
100466.00 (0.19%) |
100356.00 |
100000.00 - 100490.00 |
0.3281 times |

Monthly price and charts Msfl0 Strong monthly Stock price targets for Msfl0 977093 are 101955 and 102865 | Monthly Target 1 | 101196.67 | | Monthly Target 2 | 101803.33 | | Monthly Target 3 | 102106.66666667 | | Monthly Target 4 | 102713.33 | | Monthly Target 5 | 103016.67 |
Monthly price and volumes Msfl 0
| Date |
Closing |
Open |
Range |
Volume |
Fri 05 December 2025 |
102410.00 (-0.04%) |
102296.00 |
101500.00 - 102410.00 |
0.0143 times |
Fri 28 November 2025 |
102451.10 (1.03%) |
101401.00 |
101401.00 - 102947.00 |
0.1497 times |
Thu 30 October 2025 |
101405.00 (0.86%) |
100604.00 |
100455.00 - 101405.00 |
2.0538 times |
Mon 29 September 2025 |
100542.30 (0%) |
100000.00 |
99900.00 - 100549.00 |
1.7822 times |
Sun 07 December 2025 |
(0%) |
|
- |
0 times |

DMA SMA EMA moving averages of Msfl 0 977093
DMA (daily moving average) of Msfl 0 977093
| DMA period | DMA value | | 5 day DMA | 102112.22 | | 12 day DMA | 102177.59 | | 20 day DMA | 101982.11 | | 35 day DMA | 101480.53 | | 50 day DMA | | | 100 day DMA | | | 150 day DMA | | | 200 day DMA | | EMA (exponential moving average) of Msfl 0 977093
| EMA period | EMA current | EMA prev | EMA prev2 | | 5 day EMA | 102115.87 | 101968.83 | 102203.21 | | 12 day EMA | 102073.52 | 102012.36 | 102105.48 | | 20 day EMA | 101896.45 | 101842.42 | 101878.45 | | 35 day EMA | 101497.1 | 101443.35 | 101440.02 | | 50 day EMA | 0 | 0 | 0 |
SMA (simple moving average) of Msfl 0 977093
| SMA period | SMA current | SMA prev | SMA prev2 | | 5 day SMA | 102112.22 | 102110.22 | 102370.22 | | 12 day SMA | 102177.59 | 102164.26 | 102184.09 | | 20 day SMA | 101982.11 | 101892.71 | 101867.7 | | 35 day SMA | 101480.53 | 101427.17 | 101397.63 | | 50 day SMA | | 100 day SMA | | 150 day SMA | | 200 day SMA |
|
|
