1075msfsl28 974720 full analysis,charts,indicators,moving averages,SMA,DMA,EMA,ADX,MACD,RSI1075msfsl28 974720 WideScreen charts, DMA,SMA,EMA technical analysis, forecast prediction, by indicators ADX,MACD,RSI,CCI BSE stock exchange
Daily price and charts and targets 1075msfsl28 Strong Daily Stock price targets for 1075msfsl28 974720 are 99999 and 99999 | Daily Target 1 | 99999 | | Daily Target 2 | 99999 | | Daily Target 3 | 99999 | | Daily Target 4 | 99999 | | Daily Target 5 | 99999 |
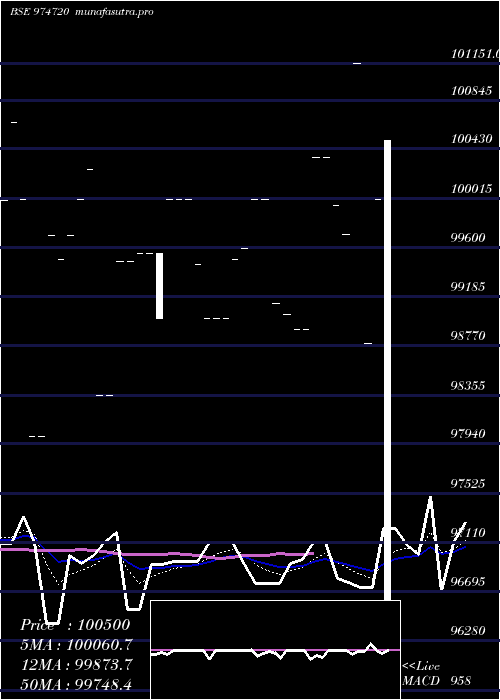
Daily price and volume 1075msfsl28
| Date |
Closing |
Open |
Range |
Volume |
Tue 02 September 2025 |
99999.00 (1.23%) |
99999.00 |
99999.00 - 99999.00 |
0.1282 times |
Thu 21 August 2025 |
98784.93 (-2.34%) |
98784.93 |
98784.93 - 98784.93 |
0.8974 times |
Wed 20 August 2025 |
101151.08 (1.45%) |
101151.08 |
101151.08 - 101151.08 |
1.6667 times |
Tue 22 July 2025 |
99702.00 (-0.25%) |
99702.00 |
99702.00 - 99702.00 |
1.9231 times |
Tue 08 July 2025 |
99950.42 (-0.4%) |
99950.42 |
99950.42 - 99950.42 |
0.2564 times |
Thu 12 June 2025 |
100353.41 (-0%) |
100353.40 |
100353.40 - 100353.42 |
0.5128 times |
Wed 11 June 2025 |
100353.42 (1.46%) |
100353.42 |
100353.42 - 100353.42 |
2.5641 times |
Mon 28 April 2025 |
98905.91 (0%) |
98905.91 |
98905.91 - 98905.91 |
0.1282 times |
Mon 24 March 2025 |
98905.91 (-0.12%) |
98905.91 |
98905.91 - 98905.91 |
0.2564 times |
Fri 07 March 2025 |
99023.72 (-0.1%) |
99023.72 |
99023.72 - 99023.72 |
1.6667 times |
Wed 12 February 2025 |
99123.18 (-0.88%) |
99123.18 |
99123.18 - 99123.18 |
1.7949 times |
Weekly price and charts 1075msfsl28 Strong weekly Stock price targets for 1075msfsl28 974720 are 99999 and 99999 | Weekly Target 1 | 99999 | | Weekly Target 2 | 99999 | | Weekly Target 3 | 99999 | | Weekly Target 4 | 99999 | | Weekly Target 5 | 99999 |
Weekly price and volumes for 1075msfsl28
| Date |
Closing |
Open |
Range |
Volume |
Tue 02 September 2025 |
99999.00 (1.23%) |
99999.00 |
99999.00 - 99999.00 |
0.0862 times |
Thu 21 August 2025 |
98784.93 (-1.17%) |
99702.00 |
98784.93 - 101151.08 |
3.0172 times |
Tue 08 July 2025 |
99950.42 (-0.4%) |
99950.42 |
99950.42 - 99950.42 |
0.1724 times |
Thu 12 June 2025 |
100353.41 (1.46%) |
98905.91 |
98905.91 - 100353.42 |
2.1552 times |
Mon 24 March 2025 |
98905.91 (-0.12%) |
98905.91 |
98905.91 - 98905.91 |
0.1724 times |
Fri 07 March 2025 |
99023.72 (-0.98%) |
99123.18 |
99023.72 - 99123.18 |
2.3276 times |
Fri 07 February 2025 |
100000.00 (0.42%) |
100000.00 |
100000.00 - 100000.00 |
1.1207 times |
Fri 03 January 2025 |
99585.51 (0.59%) |
99496.46 |
99496.46 - 99585.51 |
0.6897 times |
Thu 26 December 2024 |
99000.00 (0%) |
99000.00 |
99000.00 - 99000.00 |
0.1724 times |
Thu 19 December 2024 |
99000.00 (-0.46%) |
99000.00 |
99000.00 - 99000.00 |
0.0862 times |
Fri 29 November 2024 |
99454.14 (-0.55%) |
99454.14 |
99454.14 - 99454.14 |
0.2586 times |

Monthly price and charts 1075msfsl28 Strong monthly Stock price targets for 1075msfsl28 974720 are 99999 and 99999 | Monthly Target 1 | 99999 | | Monthly Target 2 | 99999 | | Monthly Target 3 | 99999 | | Monthly Target 4 | 99999 | | Monthly Target 5 | 99999 |
Monthly price and volumes 1075msfsl28
| Date |
Closing |
Open |
Range |
Volume |
Tue 02 September 2025 |
99999.00 (1.23%) |
99999.00 |
99999.00 - 99999.00 |
0.08 times |
Thu 21 August 2025 |
98784.93 (-0.92%) |
101151.08 |
98784.93 - 101151.08 |
1.6 times |
Tue 22 July 2025 |
99702.00 (-0.65%) |
99950.42 |
99702.00 - 99950.42 |
1.36 times |
Thu 12 June 2025 |
100353.41 (1.46%) |
100353.42 |
100353.40 - 100353.42 |
1.92 times |
Mon 28 April 2025 |
98905.91 (0%) |
98905.91 |
98905.91 - 98905.91 |
0.08 times |
Mon 24 March 2025 |
98905.91 (-0.22%) |
99023.72 |
98905.91 - 99023.72 |
1.2 times |
Wed 12 February 2025 |
99123.18 (-0.88%) |
100000.00 |
99123.18 - 100000.00 |
2.08 times |
Thu 23 January 2025 |
100000.00 (1.01%) |
99496.46 |
99496.46 - 100000.00 |
0.72 times |
Thu 26 December 2024 |
99000.00 (-0.46%) |
99000.00 |
99000.00 - 99000.00 |
0.24 times |
Fri 29 November 2024 |
99454.14 (-0.1%) |
100000.00 |
99454.14 - 100000.00 |
0.72 times |
Wed 31 July 2024 |
99550.00 (0%) |
99550.00 |
99000.00 - 99550.00 |
0.96 times |

DMA SMA EMA moving averages of 1075msfsl28 974720
DMA (daily moving average) of 1075msfsl28 974720
| DMA period | DMA value | | 5 day DMA | 99917.49 | | 12 day DMA | 99687.75 | | 20 day DMA | 99589.45 | | 35 day DMA | 99521 | | 50 day DMA | 99668.43 | | 100 day DMA | | | 150 day DMA | | | 200 day DMA | | EMA (exponential moving average) of 1075msfsl28 974720
| EMA period | EMA current | EMA prev | EMA prev2 | | 5 day EMA | 99841.15 | 99762.23 | 100250.8 | | 12 day EMA | 99759.75 | 99716.27 | 99885.54 | | 20 day EMA | 99689.16 | 99656.56 | 99748.27 | | 35 day EMA | 99660.99 | 99641.09 | 99691.49 | | 50 day EMA | 99668.32 | 99654.83 | 99690.32 |
SMA (simple moving average) of 1075msfsl28 974720
| SMA period | SMA current | SMA prev | SMA prev2 | | 5 day SMA | 99917.49 | 99988.37 | 100302.07 | | 12 day SMA | 99687.75 | 99687.83 | 99754.55 | | 20 day SMA | 99589.45 | 99589.5 | 99650.26 | | 35 day SMA | 99521 | 99463.89 | 99498.58 | | 50 day SMA | 99668.43 | 99668.31 | 99690.72 | | 100 day SMA | | 150 day SMA | | 200 day SMA |
|
|
