0eel26 974635 full analysis,charts,indicators,moving averages,SMA,DMA,EMA,ADX,MACD,RSI0eel26 974635 WideScreen charts, DMA,SMA,EMA technical analysis, forecast prediction, by indicators ADX,MACD,RSI,CCI BSE stock exchange
Daily price and charts and targets 0eel26 Strong Daily Stock price targets for 0eel26 974635 are 128605.01 and 131815 | Daily Target 1 | 125930.01 | | Daily Target 2 | 128070.01 | | Daily Target 3 | 129140.00333333 | | Daily Target 4 | 131280 | | Daily Target 5 | 132349.99 |
Daily price and volume 0eel26
| Date |
Closing |
Open |
Range |
Volume |
Fri 05 December 2025 |
130210.00 (0.03%) |
127000.01 |
127000.01 - 130210.00 |
0.4931 times |
Thu 04 December 2025 |
130176.00 (0.03%) |
130176.00 |
130176.00 - 130176.00 |
1.6333 times |
Wed 03 December 2025 |
130142.00 (0.03%) |
130142.00 |
130142.00 - 130142.00 |
0.3313 times |
Tue 02 December 2025 |
130108.00 (0.03%) |
127000.00 |
127000.00 - 130108.00 |
2.7119 times |
Mon 01 December 2025 |
130074.00 (0.08%) |
129978.00 |
129978.00 - 130074.00 |
2.5963 times |
Fri 28 November 2025 |
129973.00 (0.03%) |
128786.60 |
128786.60 - 129973.00 |
0.1926 times |
Thu 27 November 2025 |
129939.00 (0.03%) |
128800.00 |
128800.00 - 129939.00 |
1.6025 times |
Wed 26 November 2025 |
129905.00 (1.46%) |
129860.00 |
129860.00 - 129905.00 |
0.3159 times |
Tue 25 November 2025 |
128037.79 (-0.38%) |
129499.99 |
128000.00 - 129499.99 |
0.1156 times |
Mon 24 November 2025 |
128528.30 (0.12%) |
128528.30 |
128528.30 - 128528.30 |
0.0077 times |
Fri 21 November 2025 |
128376.00 (-0.87%) |
128376.00 |
128376.00 - 128400.00 |
0.7627 times |
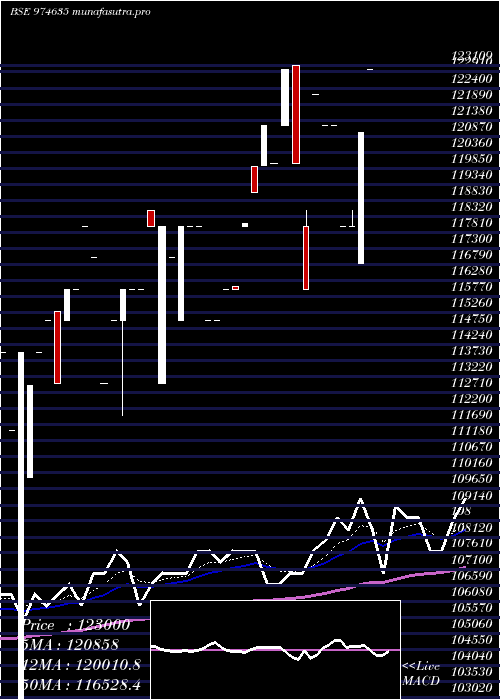
Weekly price and charts 0eel26 Strong weekly Stock price targets for 0eel26 974635 are 128605 and 131815 | Weekly Target 1 | 125930 | | Weekly Target 2 | 128070 | | Weekly Target 3 | 129140 | | Weekly Target 4 | 131280 | | Weekly Target 5 | 132350 |
Weekly price and volumes for 0eel26
| Date |
Closing |
Open |
Range |
Volume |
Fri 05 December 2025 |
130210.00 (0.18%) |
129978.00 |
127000.00 - 130210.00 |
4.484 times |
Fri 28 November 2025 |
129973.00 (1.24%) |
128528.30 |
128000.00 - 129973.00 |
1.29 times |
Fri 21 November 2025 |
128376.00 (-0.41%) |
123800.00 |
123800.00 - 129500.00 |
0.9831 times |
Thu 13 November 2025 |
128900.00 (4.12%) |
123800.00 |
123400.00 - 128900.00 |
0.1112 times |
Fri 07 November 2025 |
123800.00 (-2.98%) |
127600.00 |
123800.00 - 128900.00 |
0.1246 times |
Fri 31 October 2025 |
127600.00 (24.57%) |
127650.00 |
124000.00 - 127699.00 |
0.0311 times |
Thu 23 October 2025 |
102430.00 (-20.07%) |
124300.00 |
102430.00 - 128400.00 |
0.0578 times |
Fri 17 October 2025 |
128150.00 (0.62%) |
127800.00 |
125890.00 - 128150.00 |
0.1512 times |
Mon 29 September 2025 |
127363.00 (0.09%) |
127363.00 |
127363.00 - 127363.00 |
0.089 times |
Fri 26 September 2025 |
127254.00 (4.2%) |
122122.00 |
122122.00 - 127254.00 |
2.6779 times |
Thu 18 September 2025 |
122122.00 (-3.93%) |
126000.00 |
122122.00 - 127287.00 |
0.903 times |

Monthly price and charts 0eel26 Strong monthly Stock price targets for 0eel26 974635 are 128605 and 131815 | Monthly Target 1 | 125930 | | Monthly Target 2 | 128070 | | Monthly Target 3 | 129140 | | Monthly Target 4 | 131280 | | Monthly Target 5 | 132350 |
Monthly price and volumes 0eel26
| Date |
Closing |
Open |
Range |
Volume |
Fri 05 December 2025 |
130210.00 (0.18%) |
129978.00 |
127000.00 - 130210.00 |
0.915 times |
Fri 28 November 2025 |
129973.00 (1.86%) |
127600.00 |
123400.00 - 129973.00 |
0.512 times |
Fri 31 October 2025 |
127600.00 (0.19%) |
127800.00 |
102430.00 - 128400.00 |
0.049 times |
Mon 29 September 2025 |
127363.00 (0.35%) |
126922.00 |
122122.00 - 127363.00 |
1.8755 times |
Fri 29 August 2025 |
126922.00 (1.54%) |
125000.00 |
119001.06 - 126922.00 |
4.8248 times |
Thu 31 July 2025 |
125000.00 (0.7%) |
121000.00 |
102300.00 - 126900.00 |
0.7317 times |
Mon 23 June 2025 |
124125.00 (0.91%) |
119000.00 |
118000.00 - 125000.00 |
0.3577 times |
Fri 30 May 2025 |
123000.00 (2.5%) |
121200.00 |
116000.00 - 123109.00 |
0.3295 times |
Wed 30 April 2025 |
120000.00 (1.61%) |
119900.00 |
119090.00 - 121200.00 |
0.1098 times |
Fri 28 March 2025 |
118100.00 (1.81%) |
118500.00 |
113000.00 - 118500.00 |
0.295 times |
Fri 28 February 2025 |
116000.00 (0.87%) |
115300.00 |
112000.00 - 118000.00 |
0.0862 times |
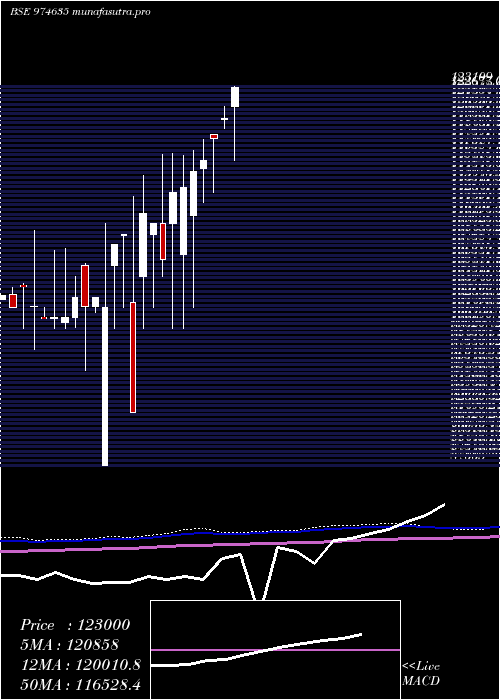
DMA SMA EMA moving averages of 0eel26 974635
DMA (daily moving average) of 0eel26 974635
| DMA period | DMA value | | 5 day DMA | 130142 | | 12 day DMA | 129580.76 | | 20 day DMA | 128428.45 | | 35 day DMA | 126894.43 | | 50 day DMA | 126776.26 | | 100 day DMA | 124628.31 | | 150 day DMA | 121346.79 | | 200 day DMA | 117850.07 | EMA (exponential moving average) of 0eel26 974635
| EMA period | EMA current | EMA prev | EMA prev2 | | 5 day EMA | 130066.82 | 129995.24 | 129904.88 | | 12 day EMA | 129377.36 | 129226.03 | 129053.37 | | 20 day EMA | 128614.97 | 128447.15 | 128265.25 | | 35 day EMA | 127864.13 | 127726.02 | 127581.78 | | 50 day EMA | 127026.54 | 126896.66 | 126762.87 |
SMA (simple moving average) of 0eel26 974635
| SMA period | SMA current | SMA prev | SMA prev2 | | 5 day SMA | 130142 | 130094.6 | 130047.2 | | 12 day SMA | 129580.76 | 129454.92 | 128923.59 | | 20 day SMA | 128428.45 | 128297.95 | 128169.15 | | 35 day SMA | 126894.43 | 126663.34 | 126580.8 | | 50 day SMA | 126776.26 | 126700.58 | 126624.92 | | 100 day SMA | 124628.31 | 124556.21 | 124454.45 | | 150 day SMA | 121346.79 | 121212.05 | 121044.21 | | 200 day SMA | 117850.07 | 117743.77 | 117632.89 |
|
|
