Ifci150212c 972715 full analysis,charts,indicators,moving averages,SMA,DMA,EMA,ADX,MACD,RSIIfci150212c 972715 WideScreen charts, DMA,SMA,EMA technical analysis, forecast prediction, by indicators ADX,MACD,RSI,CCI BSE stock exchange
Daily price and charts and targets Ifci150212c Strong Daily Stock price targets for Ifci150212c 972715 are 16599 and 16599 | Daily Target 1 | 16599 | | Daily Target 2 | 16599 | | Daily Target 3 | 16599 | | Daily Target 4 | 16599 | | Daily Target 5 | 16599 |
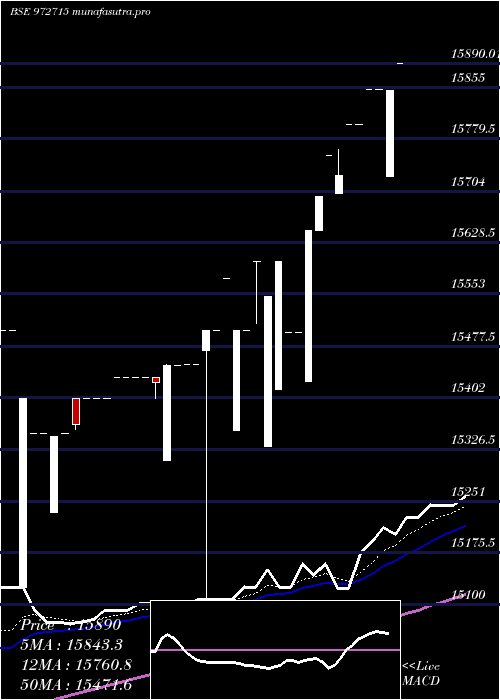
Daily price and volume Ifci150212c
| Date |
Closing |
Open |
Range |
Volume |
Fri 05 December 2025 |
16599.00 (0.34%) |
16599.00 |
16599.00 - 16599.00 |
0.1504 times |
Tue 02 December 2025 |
16543.16 (0.26%) |
16550.01 |
16543.16 - 16550.01 |
1.8045 times |
Mon 01 December 2025 |
16500.00 (-0.3%) |
16500.00 |
16500.00 - 16500.00 |
0.4511 times |
Fri 28 November 2025 |
16550.00 (0.79%) |
16275.00 |
16275.00 - 16550.00 |
0.6015 times |
Tue 25 November 2025 |
16420.00 (-0.04%) |
15711.00 |
15711.00 - 16420.00 |
0.6015 times |
Mon 24 November 2025 |
16427.20 (0.07%) |
16416.00 |
16416.00 - 16430.00 |
3.1579 times |
Fri 21 November 2025 |
16416.00 (-0%) |
16416.16 |
16200.62 - 16416.16 |
0.7519 times |
Tue 18 November 2025 |
16416.16 (-1.1%) |
16416.16 |
16416.16 - 16416.16 |
0.3008 times |
Thu 06 November 2025 |
16599.00 (1.52%) |
16400.00 |
16065.00 - 16599.00 |
1.7293 times |
Fri 31 October 2025 |
16350.00 (0%) |
16350.00 |
16350.00 - 16350.00 |
0.4511 times |
Thu 30 October 2025 |
16350.00 (0%) |
16350.00 |
16350.00 - 16350.00 |
0.3008 times |
Weekly price and charts Ifci150212c Strong weekly Stock price targets for Ifci150212c 972715 are 16549.5 and 16648.5 | Weekly Target 1 | 16467 | | Weekly Target 2 | 16533 | | Weekly Target 3 | 16566 | | Weekly Target 4 | 16632 | | Weekly Target 5 | 16665 |
Weekly price and volumes for Ifci150212c
| Date |
Closing |
Open |
Range |
Volume |
Fri 05 December 2025 |
16599.00 (0.3%) |
16500.00 |
16500.00 - 16599.00 |
0.802 times |
Fri 28 November 2025 |
16550.00 (0.82%) |
16416.00 |
15711.00 - 16550.00 |
1.4536 times |
Fri 21 November 2025 |
16416.00 (-1.1%) |
16416.16 |
16200.62 - 16416.16 |
0.3509 times |
Thu 06 November 2025 |
16599.00 (1.52%) |
16400.00 |
16065.00 - 16599.00 |
0.5764 times |
Fri 31 October 2025 |
16350.00 (0%) |
16350.00 |
16350.00 - 16350.00 |
0.401 times |
Thu 23 October 2025 |
16350.00 (0.31%) |
16300.00 |
16262.00 - 16350.00 |
0.9023 times |
Thu 09 October 2025 |
16300.00 (0.31%) |
16250.00 |
14501.00 - 16300.00 |
1.1779 times |
Fri 03 October 2025 |
16250.00 (0%) |
16250.00 |
16250.00 - 16250.00 |
0.5013 times |
Fri 26 September 2025 |
16250.00 (0%) |
16250.00 |
16100.00 - 16250.00 |
2.6065 times |
Thu 18 September 2025 |
16250.00 (0.31%) |
16200.00 |
16200.00 - 16250.00 |
1.2281 times |
Fri 12 September 2025 |
16200.00 (0.12%) |
16180.00 |
13500.00 - 16200.00 |
1.0526 times |

Monthly price and charts Ifci150212c Strong monthly Stock price targets for Ifci150212c 972715 are 16549.5 and 16648.5 | Monthly Target 1 | 16467 | | Monthly Target 2 | 16533 | | Monthly Target 3 | 16566 | | Monthly Target 4 | 16632 | | Monthly Target 5 | 16665 |
Monthly price and volumes Ifci150212c
| Date |
Closing |
Open |
Range |
Volume |
Fri 05 December 2025 |
16599.00 (0.3%) |
16500.00 |
16500.00 - 16599.00 |
0.3946 times |
Fri 28 November 2025 |
16550.00 (1.22%) |
16400.00 |
15711.00 - 16599.00 |
1.1714 times |
Fri 31 October 2025 |
16350.00 (0.62%) |
16250.00 |
14501.00 - 16350.00 |
1.4673 times |
Fri 26 September 2025 |
16250.00 (0.59%) |
16220.00 |
13500.00 - 16250.00 |
2.7127 times |
Thu 28 August 2025 |
16154.17 (0.33%) |
16101.00 |
15501.00 - 16350.00 |
0.9248 times |
Tue 29 July 2025 |
16101.00 (0.63%) |
16150.00 |
16100.00 - 16200.00 |
1.0604 times |
Mon 30 June 2025 |
16000.00 (0.69%) |
16000.00 |
15800.00 - 16000.00 |
0.4809 times |
Thu 29 May 2025 |
15890.01 (1.24%) |
15755.00 |
15700.00 - 15890.01 |
0.4562 times |
Wed 30 April 2025 |
15695.00 (0.61%) |
15330.00 |
15330.00 - 15695.00 |
0.3946 times |
Mon 24 March 2025 |
15600.00 (1.1%) |
15431.00 |
15100.00 - 15600.00 |
0.9371 times |
Thu 27 February 2025 |
15431.00 (-0.45%) |
15500.00 |
15125.00 - 15500.00 |
0.9741 times |

DMA SMA EMA moving averages of Ifci150212c 972715
DMA (daily moving average) of Ifci150212c 972715
| DMA period | DMA value | | 5 day DMA | 16522.43 | | 12 day DMA | 16460.04 | | 20 day DMA | 16402.28 | | 35 day DMA | 16325.54 | | 50 day DMA | 16260.12 | | 100 day DMA | 16008.75 | | 150 day DMA | 15695.47 | | 200 day DMA | 15367.46 | EMA (exponential moving average) of Ifci150212c 972715
| EMA period | EMA current | EMA prev | EMA prev2 | | 5 day EMA | 16532.21 | 16498.82 | 16476.65 | | 12 day EMA | 16469.51 | 16445.97 | 16428.31 | | 20 day EMA | 16418.16 | 16399.13 | 16383.98 | | 35 day EMA | 16344.47 | 16329.49 | 16316.91 | | 50 day EMA | 16275.57 | 16262.37 | 16250.91 |
SMA (simple moving average) of Ifci150212c 972715
| SMA period | SMA current | SMA prev | SMA prev2 | | 5 day SMA | 16522.43 | 16488.07 | 16462.64 | | 12 day SMA | 16460.04 | 16439.29 | 16423.2 | | 20 day SMA | 16402.28 | 16386.08 | 16371.42 | | 35 day SMA | 16325.54 | 16312.71 | 16301.59 | | 50 day SMA | 16260.12 | 16250.16 | 16241.3 | | 100 day SMA | 16008.75 | 15996.76 | 15984.96 | | 150 day SMA | 15695.47 | 15683.04 | 15670.99 | | 200 day SMA | 15367.46 | 15355.22 | 15343.25 |
|
|
