Ifci010811b 972655 full analysis,charts,indicators,moving averages,SMA,DMA,EMA,ADX,MACD,RSIIfci010811b 972655 WideScreen charts, DMA,SMA,EMA technical analysis, forecast prediction, by indicators ADX,MACD,RSI,CCI BSE stock exchange
Daily price and charts and targets Ifci010811b Strong Daily Stock price targets for Ifci010811b 972655 are 41100 and 41100 | Daily Target 1 | 41100 | | Daily Target 2 | 41100 | | Daily Target 3 | 41100 | | Daily Target 4 | 41100 | | Daily Target 5 | 41100 |
Daily price and volume Ifci010811b
| Date |
Closing |
Open |
Range |
Volume |
Fri 11 July 2025 |
41100.00 (0.49%) |
41100.00 |
41100.00 - 41100.00 |
0.1887 times |
Wed 09 July 2025 |
40900.00 (-0.06%) |
40900.00 |
40800.00 - 40900.00 |
1.1321 times |
Tue 08 July 2025 |
40925.00 (-0.06%) |
40900.00 |
40900.00 - 40950.00 |
0.3774 times |
Mon 07 July 2025 |
40950.00 (0.12%) |
40950.00 |
40950.00 - 40950.00 |
0.1887 times |
Thu 03 July 2025 |
40900.00 (0.13%) |
40815.00 |
40815.00 - 40900.00 |
0.566 times |
Wed 02 July 2025 |
40846.88 (0.28%) |
40837.84 |
40746.88 - 40946.88 |
0.7547 times |
Tue 01 July 2025 |
40733.00 (0%) |
40733.00 |
40733.00 - 40733.00 |
0.1887 times |
Mon 30 June 2025 |
40733.00 (-0.53%) |
40400.00 |
37009.10 - 40733.00 |
3.5849 times |
Thu 26 June 2025 |
40950.00 (-0.01%) |
40950.00 |
40950.00 - 40950.00 |
0.1887 times |
Tue 24 June 2025 |
40953.33 (-0.11%) |
40950.00 |
40950.00 - 40960.00 |
2.8302 times |
Thu 19 June 2025 |
41000.00 (0.24%) |
41000.00 |
41000.00 - 41000.00 |
0.3774 times |
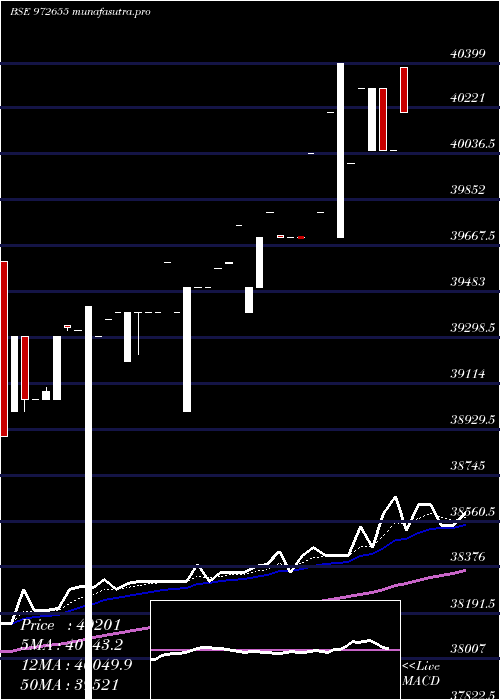
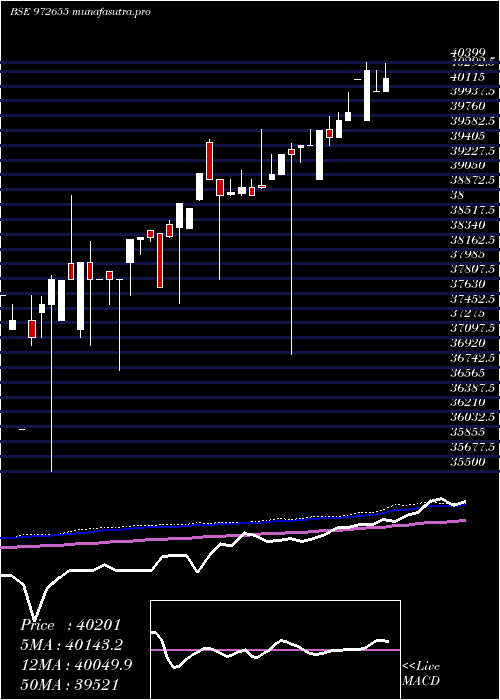
Weekly price and charts Ifci010811b Strong weekly Stock price targets for Ifci010811b 972655 are 40950 and 41250 | Weekly Target 1 | 40700 | | Weekly Target 2 | 40900 | | Weekly Target 3 | 41000 | | Weekly Target 4 | 41200 | | Weekly Target 5 | 41300 |
Weekly price and volumes for Ifci010811b
| Date |
Closing |
Open |
Range |
Volume |
Fri 11 July 2025 |
41100.00 (0.49%) |
40950.00 |
40800.00 - 41100.00 |
0.8065 times |
Thu 03 July 2025 |
40900.00 (-0.12%) |
40400.00 |
37009.10 - 40946.88 |
2.1774 times |
Thu 26 June 2025 |
40950.00 (-0.12%) |
40950.00 |
40950.00 - 40960.00 |
1.2903 times |
Thu 19 June 2025 |
41000.00 (0.12%) |
40900.00 |
40900.00 - 41000.00 |
0.8871 times |
Fri 13 June 2025 |
40950.00 (0%) |
40900.00 |
40900.00 - 40975.00 |
1.0484 times |
Fri 06 June 2025 |
40950.00 (0.12%) |
40900.00 |
40900.00 - 40950.00 |
0.3226 times |
Fri 30 May 2025 |
40900.00 (0%) |
40900.00 |
40818.00 - 40950.00 |
1.0484 times |
Fri 23 May 2025 |
40900.00 (-0.12%) |
40900.00 |
40802.00 - 40900.00 |
0.7258 times |
Wed 14 May 2025 |
40950.00 (0%) |
40900.00 |
40900.00 - 40950.00 |
0.4839 times |
Thu 08 May 2025 |
40950.00 (0.99%) |
40680.00 |
38750.00 - 40950.00 |
1.2097 times |
Fri 25 April 2025 |
40550.00 (0.87%) |
40301.00 |
40301.00 - 40550.00 |
0.6452 times |
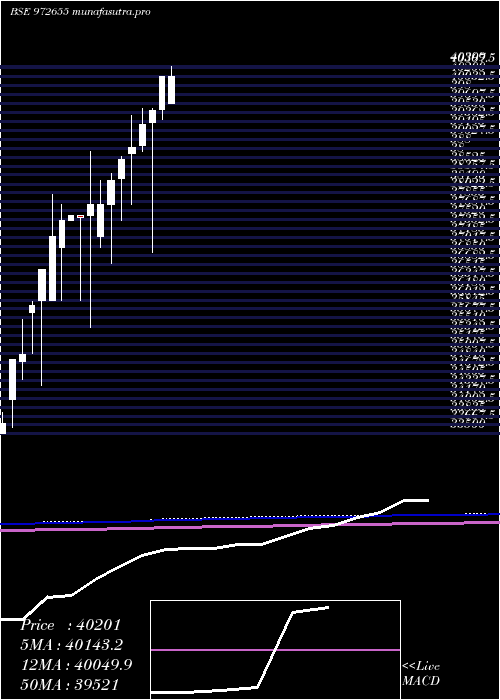
Monthly price and charts Ifci010811b Strong monthly Stock price targets for Ifci010811b 972655 are 40916.5 and 41283.5 | Monthly Target 1 | 40610.67 | | Monthly Target 2 | 40855.33 | | Monthly Target 3 | 40977.666666667 | | Monthly Target 4 | 41222.33 | | Monthly Target 5 | 41344.67 |
Monthly price and volumes Ifci010811b
| Date |
Closing |
Open |
Range |
Volume |
Fri 11 July 2025 |
41100.00 (0.9%) |
40733.00 |
40733.00 - 41100.00 |
0.3291 times |
Mon 30 June 2025 |
40733.00 (-0.41%) |
40900.00 |
37009.10 - 41000.00 |
1.1517 times |
Fri 30 May 2025 |
40900.00 (0.25%) |
40900.00 |
40802.00 - 40950.00 |
0.6764 times |
Tue 29 April 2025 |
40800.00 (1.49%) |
39700.00 |
38750.00 - 40800.00 |
0.713 times |
Wed 26 March 2025 |
40200.00 (1.58%) |
39593.00 |
39401.00 - 40200.00 |
0.4205 times |
Fri 28 February 2025 |
39575.00 (0.7%) |
39350.00 |
36900.00 - 39599.00 |
0.5302 times |
Fri 31 January 2025 |
39300.00 (1.12%) |
38900.00 |
38800.00 - 39600.00 |
1.1517 times |
Tue 31 December 2024 |
38866.00 (0.56%) |
38760.00 |
37800.00 - 39475.00 |
2.7422 times |
Fri 29 November 2024 |
38651.00 (1.05%) |
38300.00 |
37510.00 - 38708.00 |
0.8044 times |
Thu 31 October 2024 |
38250.00 (1.19%) |
37800.00 |
36700.25 - 38380.00 |
1.4808 times |
Fri 27 September 2024 |
37800.00 (0%) |
37200.00 |
37000.00 - 38250.00 |
0.7678 times |
DMA SMA EMA moving averages of Ifci010811b 972655
DMA (daily moving average) of Ifci010811b 972655
| DMA period | DMA value | | 5 day DMA | 40955 | | 12 day DMA | 40907.6 | | 20 day DMA | 40924.36 | | 35 day DMA | 40911.63 | | 50 day DMA | 40700.61 | | 100 day DMA | 39944.57 | | 150 day DMA | 39336.14 | | 200 day DMA | 38742.76 | EMA (exponential moving average) of Ifci010811b 972655
| EMA period | EMA current | EMA prev | EMA prev2 | | 5 day EMA | 40966.88 | 40900.33 | 40900.49 | | 12 day EMA | 40927.05 | 40895.61 | 40894.81 | | 20 day EMA | 40895.56 | 40874.05 | 40871.32 | | 35 day EMA | 40764.98 | 40745.26 | 40736.15 | | 50 day EMA | 40642.82 | 40624.17 | 40612.92 |
SMA (simple moving average) of Ifci010811b 972655
| SMA period | SMA current | SMA prev | SMA prev2 | | 5 day SMA | 40955 | 40904.38 | 40870.98 | | 12 day SMA | 40907.6 | 40892.68 | 40898.93 | | 20 day SMA | 40924.36 | 40914.36 | 40914.36 | | 35 day SMA | 40911.63 | 40899.63 | 40889.63 | | 50 day SMA | 40700.61 | 40672.61 | 40648.61 | | 100 day SMA | 39944.57 | 39923.67 | 39908.67 | | 150 day SMA | 39336.14 | 39312.81 | 39290.14 | | 200 day SMA | 38742.76 | 38716.76 | 38692.01 |
|
|
