762ntpc35f 961910 full analysis,charts,indicators,moving averages,SMA,DMA,EMA,ADX,MACD,RSI762ntpc35f 961910 WideScreen charts, DMA,SMA,EMA technical analysis, forecast prediction, by indicators ADX,MACD,RSI,CCI BSE stock exchange
Daily price and charts and targets 762ntpc35f Strong Daily Stock price targets for 762ntpc35f 961910 are 1205.13 and 1205.13 | Daily Target 1 | 1205.13 | | Daily Target 2 | 1205.13 | | Daily Target 3 | 1205.13 | | Daily Target 4 | 1205.13 | | Daily Target 5 | 1205.13 |
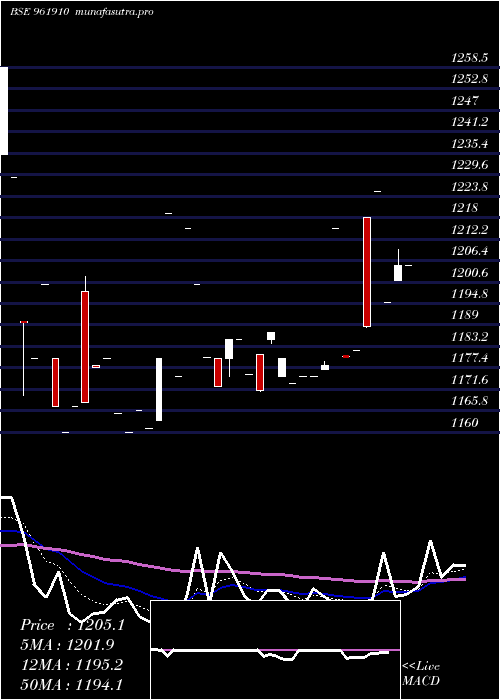
Daily price and volume 762ntpc35f
| Date |
Closing |
Open |
Range |
Volume |
| Mon 02 June 2025 |
1205.13 (0%) |
1205.13 |
1205.13 - 1205.13 |
0.2092 times |
| Fri 30 May 2025 |
1205.13 (0.84%) |
1201.01 |
1201.01 - 1209.50 |
2.1727 times |
| Fri 23 May 2025 |
1195.10 (-2.44%) |
1195.10 |
1195.10 - 1195.10 |
0.3374 times |
| Thu 17 April 2025 |
1225.00 (3.07%) |
1225.00 |
1225.00 - 1225.00 |
0.4049 times |
| Wed 16 April 2025 |
1188.47 (0.55%) |
1217.99 |
1188.38 - 1217.99 |
4.332 times |
| Tue 15 April 2025 |
1182.01 (0.13%) |
1182.01 |
1182.01 - 1182.01 |
0.108 times |
| Wed 26 March 2025 |
1180.51 (-2.84%) |
1180.63 |
1180.51 - 1180.63 |
0.9177 times |
| Tue 18 March 2025 |
1215.00 (3.13%) |
1215.00 |
1215.00 - 1215.00 |
0.4049 times |
| Fri 07 March 2025 |
1178.10 (0.26%) |
1177.05 |
1177.05 - 1179.00 |
0.6883 times |
| Tue 25 February 2025 |
1175.00 (0%) |
1175.00 |
1175.00 - 1175.00 |
0.4251 times |
| Fri 21 February 2025 |
1175.00 (0.16%) |
1175.00 |
1175.00 - 1175.00 |
1.0594 times |
Weekly price and charts 762ntpc35f Strong weekly Stock price targets for 762ntpc35f 961910 are 1205.13 and 1205.13 | Weekly Target 1 | 1205.13 | | Weekly Target 2 | 1205.13 | | Weekly Target 3 | 1205.13 | | Weekly Target 4 | 1205.13 | | Weekly Target 5 | 1205.13 |
Weekly price and volumes for 762ntpc35f
| Date |
Closing |
Open |
Range |
Volume |
| Mon 02 June 2025 |
1205.13 (0%) |
1205.13 |
1205.13 - 1205.13 |
0.0916 times |
| Fri 30 May 2025 |
1205.13 (0.84%) |
1201.01 |
1201.01 - 1209.50 |
0.951 times |
| Fri 23 May 2025 |
1195.10 (1.24%) |
1182.01 |
1182.01 - 1225.00 |
2.2682 times |
| Wed 26 March 2025 |
1180.51 (0.2%) |
1215.00 |
1180.51 - 1215.00 |
0.5789 times |
| Fri 07 March 2025 |
1178.10 (0.26%) |
1175.00 |
1175.00 - 1179.00 |
0.4873 times |
| Fri 21 February 2025 |
1175.00 (-0.42%) |
1173.10 |
1173.10 - 1175.00 |
0.6054 times |
| Fri 07 February 2025 |
1180.00 (0.38%) |
1181.00 |
1171.00 - 1187.00 |
3.1896 times |
| Thu 23 January 2025 |
1175.50 (-0.8%) |
1175.50 |
1175.50 - 1175.50 |
0.2363 times |
| Thu 16 January 2025 |
1184.99 (-1.25%) |
1180.06 |
1172.41 - 1185.00 |
1.5859 times |
| Thu 02 January 2025 |
1200.00 (-1.23%) |
1200.00 |
1200.00 - 1200.00 |
0.0059 times |
| Thu 26 December 2024 |
1215.00 (-0.33%) |
1175.00 |
1175.00 - 1215.00 |
0.0945 times |

Monthly price and charts 762ntpc35f Strong monthly Stock price targets for 762ntpc35f 961910 are 1205.13 and 1205.13 | Monthly Target 1 | 1205.13 | | Monthly Target 2 | 1205.13 | | Monthly Target 3 | 1205.13 | | Monthly Target 4 | 1205.13 | | Monthly Target 5 | 1205.13 |
Monthly price and volumes 762ntpc35f
| Date |
Closing |
Open |
Range |
Volume |
| Mon 02 June 2025 |
1205.13 (0%) |
1205.13 |
1205.13 - 1205.13 |
0.0487 times |
| Fri 30 May 2025 |
1205.13 (-1.62%) |
1195.10 |
1195.10 - 1209.50 |
0.5844 times |
| Thu 17 April 2025 |
1225.00 (3.77%) |
1182.01 |
1182.01 - 1225.00 |
1.1279 times |
| Wed 26 March 2025 |
1180.51 (0.47%) |
1177.05 |
1177.05 - 1215.00 |
0.4681 times |
| Tue 25 February 2025 |
1175.00 (0.32%) |
1185.00 |
1173.10 - 1187.00 |
1.6117 times |
| Mon 27 January 2025 |
1171.20 (-3.6%) |
1200.00 |
1171.00 - 1200.00 |
1.4782 times |
| Thu 26 December 2024 |
1215.00 (-0.33%) |
1175.00 |
1175.00 - 1215.00 |
0.0503 times |
| Fri 29 November 2024 |
1219.00 (5.09%) |
1166.00 |
1161.00 - 1219.00 |
0.2341 times |
| Tue 29 October 2024 |
1160.00 (-1.69%) |
1200.00 |
1160.00 - 1202.01 |
1.5928 times |
| Tue 24 September 2024 |
1180.00 (-4.07%) |
1223.65 |
1170.00 - 1258.50 |
2.804 times |
| Fri 30 August 2024 |
1230.00 (2.07%) |
1210.00 |
1210.00 - 1230.00 |
1.7531 times |

DMA SMA EMA moving averages of 762ntpc35f 961910
DMA (daily moving average) of 762ntpc35f 961910
| DMA period | DMA value | | 5 day DMA | 1203.77 | | 12 day DMA | 1191.46 | | 20 day DMA | 1186.69 | | 35 day DMA | 1182.69 | | 50 day DMA | 1193.44 | | 100 day DMA | 1202.81 | | 150 day DMA | 1210.06 | | 200 day DMA | 1221.66 | EMA (exponential moving average) of 762ntpc35f 961910
| EMA period | EMA current | EMA prev | EMA prev2 | | 5 day EMA | 1201.87 | 1200.24 | 1197.79 | | 12 day EMA | 1195.21 | 1193.41 | 1191.28 | | 20 day EMA | 1191.98 | 1190.6 | 1189.07 | | 35 day EMA | 1193.36 | 1192.67 | 1191.94 | | 50 day EMA | 1196.57 | 1196.22 | 1195.86 |
SMA (simple moving average) of 762ntpc35f 961910
| SMA period | SMA current | SMA prev | SMA prev2 | | 5 day SMA | 1203.77 | 1199.14 | 1194.22 | | 12 day SMA | 1191.46 | 1189.37 | 1187.86 | | 20 day SMA | 1186.69 | 1186.43 | 1186.92 | | 35 day SMA | 1182.69 | 1182.55 | 1181.83 | | 50 day SMA | 1193.44 | 1193.7 | 1193.9 | | 100 day SMA | 1202.81 | 1202.61 | 1202.56 | | 150 day SMA | 1210.06 | 1210.07 | 1210.09 | | 200 day SMA | 1221.66 | 1222.05 | 1222.43 |
|
|
