880ireda29 961839 full analysis,charts,indicators,moving averages,SMA,DMA,EMA,ADX,MACD,RSI880ireda29 961839 WideScreen charts, DMA,SMA,EMA technical analysis, forecast prediction, by indicators ADX,MACD,RSI,CCI BSE stock exchange
Daily price and charts and targets 880ireda29 Strong Daily Stock price targets for 880ireda29 961839 are 1160 and 1160 | Daily Target 1 | 1160 | | Daily Target 2 | 1160 | | Daily Target 3 | 1160 | | Daily Target 4 | 1160 | | Daily Target 5 | 1160 |
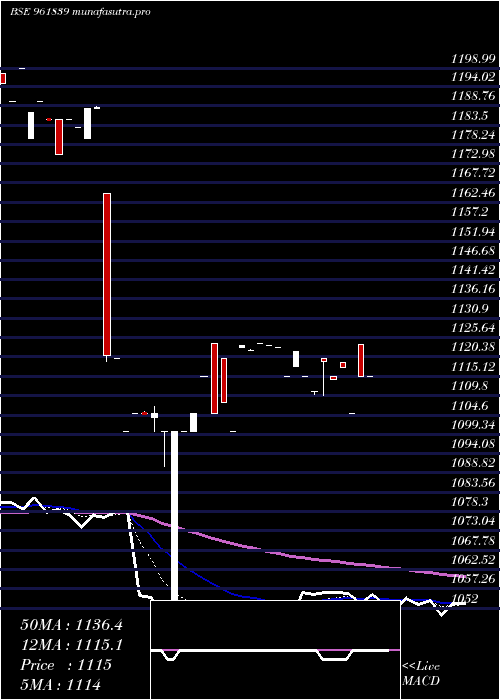
Daily price and volume 880ireda29
| Date |
Closing |
Open |
Range |
Volume |
Tue 21 October 2025 |
1160.00 (-0.43%) |
1160.00 |
1160.00 - 1160.00 |
0.0168 times |
Mon 20 October 2025 |
1165.00 (0.43%) |
1165.00 |
1165.00 - 1165.00 |
0.0168 times |
Fri 17 October 2025 |
1160.00 (-0.3%) |
1160.00 |
1160.00 - 1160.00 |
0.0168 times |
Thu 16 October 2025 |
1163.49 (1.17%) |
1163.49 |
1163.49 - 1163.49 |
0.0168 times |
Wed 15 October 2025 |
1150.00 (-1.07%) |
1150.00 |
1150.00 - 1150.00 |
0.6061 times |
Tue 14 October 2025 |
1162.39 (1.95%) |
1161.99 |
1161.99 - 1162.79 |
0.0337 times |
Mon 13 October 2025 |
1140.20 (-0.94%) |
1140.20 |
1140.20 - 1140.20 |
6.734 times |
Fri 10 October 2025 |
1151.00 (0.09%) |
1151.00 |
1151.00 - 1151.00 |
0.0168 times |
Thu 09 October 2025 |
1150.00 (-1.27%) |
1150.00 |
1150.00 - 1150.00 |
0.0168 times |
Wed 08 October 2025 |
1164.80 (2.54%) |
1140.00 |
1140.00 - 1164.80 |
2.5253 times |
Tue 07 October 2025 |
1136.00 (-1.23%) |
1136.00 |
1136.00 - 1136.00 |
0.5219 times |
Weekly price and charts 880ireda29 Strong weekly Stock price targets for 880ireda29 961839 are 1157.5 and 1162.5 | Weekly Target 1 | 1156.67 | | Weekly Target 2 | 1158.33 | | Weekly Target 3 | 1161.6666666667 | | Weekly Target 4 | 1163.33 | | Weekly Target 5 | 1166.67 |
Weekly price and volumes for 880ireda29
| Date |
Closing |
Open |
Range |
Volume |
Tue 21 October 2025 |
1160.00 (0%) |
1165.00 |
1160.00 - 1165.00 |
0.0122 times |
Fri 17 October 2025 |
1160.00 (0.78%) |
1140.20 |
1140.20 - 1163.49 |
2.6764 times |
Fri 10 October 2025 |
1151.00 (0.09%) |
1155.00 |
1136.00 - 1164.80 |
1.7883 times |
Fri 03 October 2025 |
1150.00 (0%) |
1155.00 |
1150.00 - 1160.00 |
0.7786 times |
Fri 26 September 2025 |
1150.00 (-0.86%) |
1150.00 |
1131.28 - 1160.00 |
0.9428 times |
Fri 19 September 2025 |
1160.00 (1%) |
1140.00 |
1140.00 - 1160.00 |
0.2616 times |
Fri 12 September 2025 |
1148.50 (-0.13%) |
1154.00 |
1145.00 - 1154.00 |
0.2068 times |
Fri 05 September 2025 |
1150.00 (1.77%) |
1145.00 |
1145.00 - 1156.90 |
0.0304 times |
Fri 29 August 2025 |
1130.00 (-1.74%) |
1149.00 |
1130.00 - 1149.00 |
1.5998 times |
Fri 22 August 2025 |
1150.00 (0%) |
1130.00 |
1125.31 - 1150.00 |
1.7032 times |
Thu 14 August 2025 |
1150.00 (0.88%) |
1135.00 |
1135.00 - 1155.00 |
0.0243 times |

Monthly price and charts 880ireda29 Strong monthly Stock price targets for 880ireda29 961839 are 1145.5 and 1174.5 | Monthly Target 1 | 1124.67 | | Monthly Target 2 | 1142.33 | | Monthly Target 3 | 1153.6666666667 | | Monthly Target 4 | 1171.33 | | Monthly Target 5 | 1182.67 |
Monthly price and volumes 880ireda29
| Date |
Closing |
Open |
Range |
Volume |
Tue 21 October 2025 |
1160.00 (0.07%) |
1160.00 |
1136.00 - 1165.00 |
0.5261 times |
Tue 30 September 2025 |
1159.20 (2.58%) |
1145.00 |
1131.28 - 1160.00 |
0.2587 times |
Fri 29 August 2025 |
1130.00 (-0.88%) |
1145.00 |
1125.31 - 1155.00 |
0.3956 times |
Thu 31 July 2025 |
1140.00 (1.06%) |
1135.00 |
1118.73 - 1149.99 |
2.8227 times |
Mon 30 June 2025 |
1128.00 (-0.59%) |
1134.90 |
1117.02 - 1148.39 |
1.8455 times |
Fri 30 May 2025 |
1134.74 (1.14%) |
1124.00 |
1112.00 - 1137.99 |
0.4926 times |
Wed 30 April 2025 |
1122.00 (0.63%) |
1117.90 |
1105.00 - 1123.90 |
0.5253 times |
Fri 28 March 2025 |
1115.00 (-0.45%) |
1100.00 |
1052.00 - 1124.00 |
1.4199 times |
Fri 28 February 2025 |
1120.00 (-5.49%) |
1200.00 |
1119.00 - 1200.00 |
1.6138 times |
Fri 31 January 2025 |
1185.00 (0.25%) |
1182.50 |
1180.00 - 1213.87 |
0.0998 times |
Tue 31 December 2024 |
1182.00 (0.17%) |
1185.00 |
1170.00 - 1195.00 |
0.0442 times |

DMA SMA EMA moving averages of 880ireda29 961839
DMA (daily moving average) of 880ireda29 961839
| DMA period | DMA value | | 5 day DMA | 1159.7 | | 12 day DMA | 1154.41 | | 20 day DMA | 1153.76 | | 35 day DMA | 1151.6 | | 50 day DMA | 1148.31 | | 100 day DMA | 1141.01 | | 150 day DMA | 1133.33 | | 200 day DMA | 1145.19 | EMA (exponential moving average) of 880ireda29 961839
| EMA period | EMA current | EMA prev | EMA prev2 | | 5 day EMA | 1159.83 | 1159.75 | 1157.13 | | 12 day EMA | 1156.61 | 1155.99 | 1154.35 | | 20 day EMA | 1154.47 | 1153.89 | 1152.72 | | 35 day EMA | 1151.33 | 1150.82 | 1149.99 | | 50 day EMA | 1148.71 | 1148.25 | 1147.57 |
SMA (simple moving average) of 880ireda29 961839
| SMA period | SMA current | SMA prev | SMA prev2 | | 5 day SMA | 1159.7 | 1160.18 | 1155.22 | | 12 day SMA | 1154.41 | 1153.58 | 1153.16 | | 20 day SMA | 1153.76 | 1153.26 | 1153.01 | | 35 day SMA | 1151.6 | 1151.17 | 1150.17 | | 50 day SMA | 1148.31 | 1147.81 | 1147.41 | | 100 day SMA | 1141.01 | 1140.75 | 1140.48 | | 150 day SMA | 1133.33 | 1132.96 | 1132.56 | | 200 day SMA | 1145.19 | 1145.27 | 1145.34 |
|
|
