840irfc29 961828 full analysis,charts,indicators,moving averages,SMA,DMA,EMA,ADX,MACD,RSI840irfc29 961828 WideScreen charts, DMA,SMA,EMA technical analysis, forecast prediction, by indicators ADX,MACD,RSI,CCI BSE stock exchange
Daily price and charts and targets 840irfc29 Strong Daily Stock price targets for 840irfc29 961828 are 1130 and 1130 | Daily Target 1 | 1130 | | Daily Target 2 | 1130 | | Daily Target 3 | 1130 | | Daily Target 4 | 1130 | | Daily Target 5 | 1130 |
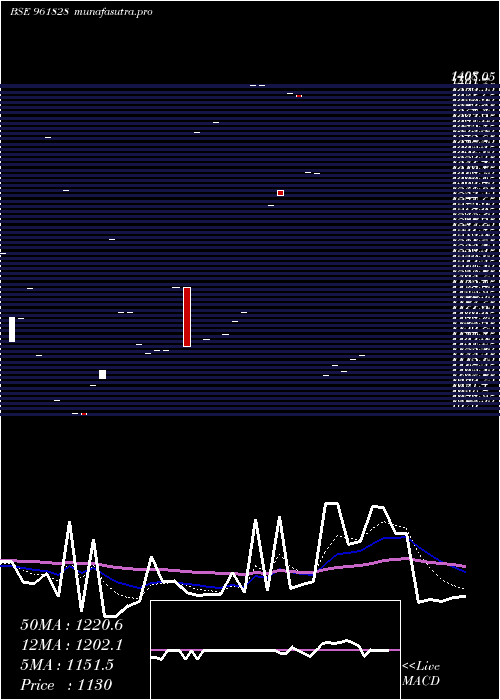
Daily price and volume 840irfc29
| Date |
Closing |
Open |
Range |
Volume |
Mon 20 October 2025 |
1130.00 (0.3%) |
1130.00 |
1130.00 - 1130.00 |
0.1369 times |
Tue 14 October 2025 |
1126.67 (1.13%) |
1126.67 |
1126.67 - 1126.67 |
0.1369 times |
Mon 22 September 2025 |
1114.10 (-0.53%) |
1114.10 |
1114.10 - 1114.10 |
0.0548 times |
Thu 04 September 2025 |
1120.00 (0.89%) |
1120.00 |
1120.00 - 1120.00 |
0.1369 times |
Mon 01 September 2025 |
1110.10 (-15.77%) |
1110.00 |
1110.00 - 1110.10 |
0.3422 times |
Fri 01 August 2025 |
1318.00 (-0.03%) |
1318.00 |
1318.00 - 1318.00 |
0.0068 times |
Tue 08 July 2025 |
1318.40 (-5.63%) |
1318.40 |
1318.40 - 1318.40 |
1.102 times |
Wed 12 March 2025 |
1397.00 (-0.21%) |
1398.00 |
1397.00 - 1398.00 |
6.2012 times |
Mon 24 February 2025 |
1399.99 (8.11%) |
1399.99 |
1399.99 - 1399.99 |
0.0068 times |
Fri 03 January 2025 |
1295.00 (0.78%) |
1300.00 |
1295.00 - 1300.00 |
1.8754 times |
Thu 02 January 2025 |
1285.00 (-8.74%) |
1284.90 |
1284.90 - 1285.00 |
2.9432 times |
Weekly price and charts 840irfc29 Strong weekly Stock price targets for 840irfc29 961828 are 1130 and 1130 | Weekly Target 1 | 1130 | | Weekly Target 2 | 1130 | | Weekly Target 3 | 1130 | | Weekly Target 4 | 1130 | | Weekly Target 5 | 1130 |
Weekly price and volumes for 840irfc29
| Date |
Closing |
Open |
Range |
Volume |
Mon 20 October 2025 |
1130.00 (0.3%) |
1130.00 |
1130.00 - 1130.00 |
0.0031 times |
Tue 14 October 2025 |
1126.67 (0.6%) |
1114.10 |
1114.10 - 1126.67 |
0.0043 times |
Thu 04 September 2025 |
1120.00 (-15.02%) |
1110.00 |
1110.00 - 1120.00 |
0.0108 times |
Fri 01 August 2025 |
1318.00 (-5.65%) |
1318.40 |
1318.00 - 1318.40 |
0.0251 times |
Wed 12 March 2025 |
1397.00 (7.88%) |
1399.99 |
1397.00 - 1399.99 |
0.1404 times |
Fri 03 January 2025 |
1295.00 (-8.03%) |
1284.90 |
1284.90 - 1300.00 |
0.109 times |
Fri 13 December 2024 |
1408.00 (0%) |
1408.00 |
1408.00 - 1408.00 |
0.0542 times |
Fri 06 December 2024 |
1408.00 (22.22%) |
1165.00 |
1165.00 - 1408.00 |
0.6862 times |
Thu 14 November 2024 |
1152.05 (1.06%) |
1360.00 |
1146.37 - 1370.00 |
1.1802 times |
Mon 29 July 2024 |
1140.00 (-5%) |
1200.00 |
1140.00 - 1200.00 |
7.7867 times |
Fri 26 July 2024 |
1200.00 (5.73%) |
1135.01 |
1135.01 - 1200.00 |
7.7402 times |

Monthly price and charts 840irfc29 Strong monthly Stock price targets for 840irfc29 961828 are 1128.34 and 1131.67 | Monthly Target 1 | 1125.56 | | Monthly Target 2 | 1127.78 | | Monthly Target 3 | 1128.89 | | Monthly Target 4 | 1131.11 | | Monthly Target 5 | 1132.22 |
Monthly price and volumes 840irfc29
| Date |
Closing |
Open |
Range |
Volume |
Mon 20 October 2025 |
1130.00 (1.43%) |
1126.67 |
1126.67 - 1130.00 |
0.0301 times |
Mon 22 September 2025 |
1114.10 (-15.47%) |
1110.00 |
1110.00 - 1120.00 |
0.0586 times |
Fri 01 August 2025 |
1318.00 (-0.03%) |
1318.00 |
1318.00 - 1318.00 |
0.0008 times |
Tue 08 July 2025 |
1318.40 (-5.63%) |
1318.40 |
1318.40 - 1318.40 |
0.121 times |
Wed 12 March 2025 |
1397.00 (-0.21%) |
1398.00 |
1397.00 - 1398.00 |
0.681 times |
Mon 24 February 2025 |
1399.99 (8.11%) |
1399.99 |
1399.99 - 1399.99 |
0.0008 times |
Fri 03 January 2025 |
1295.00 (-8.03%) |
1284.90 |
1284.90 - 1300.00 |
0.5292 times |
Fri 13 December 2024 |
1408.00 (19.83%) |
1408.00 |
1408.00 - 1408.00 |
0.4623 times |
Wed 27 November 2024 |
1175.00 (2.5%) |
1370.00 |
1152.05 - 1370.00 |
4.3577 times |
Tue 22 October 2024 |
1146.37 (-15.71%) |
1146.37 |
1146.37 - 1146.37 |
3.7586 times |
Mon 16 September 2024 |
1360.00 (19.3%) |
1360.00 |
1360.00 - 1360.00 |
0.748 times |

DMA SMA EMA moving averages of 840irfc29 961828
DMA (daily moving average) of 840irfc29 961828
| DMA period | DMA value | | 5 day DMA | 1120.17 | | 12 day DMA | 1251.86 | | 20 day DMA | 1246.93 | | 35 day DMA | 1210.75 | | 50 day DMA | 1207.5 | | 100 day DMA | | | 150 day DMA | | | 200 day DMA | | EMA (exponential moving average) of 840irfc29 961828
| EMA period | EMA current | EMA prev | EMA prev2 | | 5 day EMA | 1151.54 | 1162.31 | 1180.12 | | 12 day EMA | 1202.06 | 1215.16 | 1231.24 | | 20 day EMA | 1216.07 | 1225.13 | 1235.49 | | 35 day EMA | 1218.46 | 1223.67 | 1229.38 | | 50 day EMA | 1197.37 | 1200.12 | 1203.12 |
SMA (simple moving average) of 840irfc29 961828
| SMA period | SMA current | SMA prev | SMA prev2 | | 5 day SMA | 1120.17 | 1157.77 | 1196.12 | | 12 day SMA | 1251.86 | 1275.02 | 1279.05 | | 20 day SMA | 1246.93 | 1250.43 | 1250.85 | | 35 day SMA | 1210.75 | 1210.75 | 1212.82 | | 50 day SMA | 1207.5 | 1208.44 | 1209.41 | | 100 day SMA | | 150 day SMA | | 200 day SMA |
|
|
