734irfc2028 961756 full analysis,charts,indicators,moving averages,SMA,DMA,EMA,ADX,MACD,RSI734irfc2028 961756 WideScreen charts, DMA,SMA,EMA technical analysis, forecast prediction, by indicators ADX,MACD,RSI,CCI BSE stock exchange
Daily price and charts and targets 734irfc2028 Strong Daily Stock price targets for 734irfc2028 961756 are 1041.67 and 1043.67 | Daily Target 1 | 1040.11 | | Daily Target 2 | 1041.22 | | Daily Target 3 | 1042.11 | | Daily Target 4 | 1043.22 | | Daily Target 5 | 1044.11 |
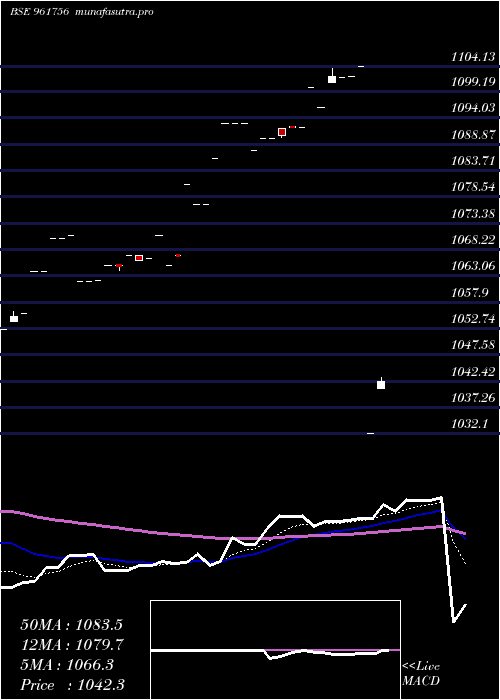
Daily price and volume 734irfc2028
| Date |
Closing |
Open |
Range |
Volume |
Mon 20 October 2025 |
1042.33 (0.99%) |
1041.00 |
1041.00 - 1043.00 |
0.7057 times |
Tue 30 September 2025 |
1032.10 (-6.52%) |
1032.10 |
1032.10 - 1032.10 |
0.5622 times |
Fri 26 September 2025 |
1104.13 (0.19%) |
1104.13 |
1104.13 - 1104.13 |
0.0353 times |
Fri 12 September 2025 |
1102.05 (0%) |
1102.05 |
1102.05 - 1102.05 |
0.0353 times |
Tue 09 September 2025 |
1102.01 (-0%) |
1102.01 |
1102.01 - 1102.01 |
0.0188 times |
Wed 20 August 2025 |
1102.04 (0.55%) |
1101.01 |
1101.01 - 1103.70 |
6.1162 times |
Fri 08 August 2025 |
1096.00 (-0.35%) |
1096.00 |
1096.00 - 1096.00 |
2.0536 times |
Tue 22 July 2025 |
1099.90 (0.71%) |
1099.90 |
1099.90 - 1099.90 |
0.2352 times |
Tue 15 July 2025 |
1092.10 (-0.01%) |
1092.10 |
1092.10 - 1092.10 |
0.0024 times |
Wed 09 July 2025 |
1092.20 (0.15%) |
1092.21 |
1092.20 - 1092.21 |
0.2352 times |
Fri 04 July 2025 |
1090.55 (0.04%) |
1092.00 |
1090.10 - 1092.00 |
0.7928 times |
Weekly price and charts 734irfc2028 Strong weekly Stock price targets for 734irfc2028 961756 are 1041.67 and 1043.67 | Weekly Target 1 | 1040.11 | | Weekly Target 2 | 1041.22 | | Weekly Target 3 | 1042.11 | | Weekly Target 4 | 1043.22 | | Weekly Target 5 | 1044.11 |
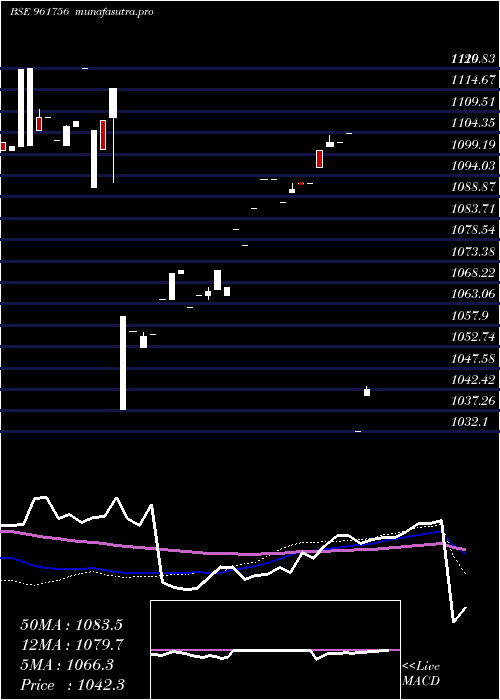
Weekly price and volumes for 734irfc2028
| Date |
Closing |
Open |
Range |
Volume |
Mon 20 October 2025 |
1042.33 (0.99%) |
1041.00 |
1041.00 - 1043.00 |
0.6482 times |
Tue 30 September 2025 |
1032.10 (-6.52%) |
1032.10 |
1032.10 - 1032.10 |
0.5164 times |
Fri 26 September 2025 |
1104.13 (0.19%) |
1104.13 |
1104.13 - 1104.13 |
0.0324 times |
Fri 12 September 2025 |
1102.05 (0%) |
1102.01 |
1102.01 - 1102.05 |
0.0497 times |
Wed 20 August 2025 |
1102.04 (0.55%) |
1101.01 |
1101.01 - 1103.70 |
5.618 times |
Fri 08 August 2025 |
1096.00 (0.36%) |
1099.90 |
1096.00 - 1099.90 |
2.1024 times |
Tue 15 July 2025 |
1092.10 (-0.01%) |
1092.10 |
1092.10 - 1092.10 |
0.0022 times |
Wed 09 July 2025 |
1092.20 (0.15%) |
1092.21 |
1092.20 - 1092.21 |
0.2161 times |
Fri 04 July 2025 |
1090.55 (0.28%) |
1090.01 |
1090.01 - 1092.00 |
0.793 times |
Mon 16 June 2025 |
1087.54 (-0.5%) |
1087.54 |
1087.54 - 1087.54 |
0.0216 times |
Mon 26 May 2025 |
1093.00 (0%) |
1093.00 |
1093.00 - 1093.00 |
0.1966 times |
Monthly price and charts 734irfc2028 Strong monthly Stock price targets for 734irfc2028 961756 are 1041.67 and 1043.67 | Monthly Target 1 | 1040.11 | | Monthly Target 2 | 1041.22 | | Monthly Target 3 | 1042.11 | | Monthly Target 4 | 1043.22 | | Monthly Target 5 | 1044.11 |
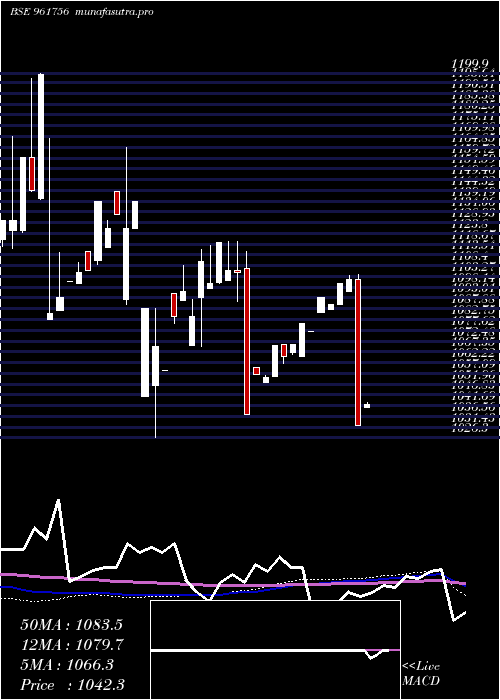
Monthly price and volumes 734irfc2028
| Date |
Closing |
Open |
Range |
Volume |
Mon 20 October 2025 |
1042.33 (0.99%) |
1041.00 |
1041.00 - 1043.00 |
0.0059 times |
Tue 30 September 2025 |
1032.10 (-6.35%) |
1102.01 |
1032.10 - 1104.13 |
0.0055 times |
Wed 20 August 2025 |
1102.04 (0.19%) |
1096.00 |
1096.00 - 1103.70 |
0.0686 times |
Tue 22 July 2025 |
1099.90 (0.91%) |
1090.06 |
1090.06 - 1099.90 |
0.0107 times |
Mon 30 June 2025 |
1090.01 (-0.27%) |
1087.54 |
1087.54 - 1090.01 |
0.0008 times |
Mon 26 May 2025 |
1093.00 (1.49%) |
1086.10 |
1086.10 - 1093.00 |
9.8784 times |
Thu 17 April 2025 |
1077.00 (-0.37%) |
1077.00 |
1077.00 - 1077.00 |
0.0012 times |
Thu 13 March 2025 |
1080.99 (0.93%) |
1065.00 |
1065.00 - 1080.99 |
0.002 times |
Thu 27 February 2025 |
1071.00 (0.56%) |
1067.00 |
1066.10 - 1071.00 |
0.014 times |
Tue 28 January 2025 |
1065.00 (-0.51%) |
1071.00 |
1062.01 - 1071.00 |
0.013 times |
Mon 30 December 2024 |
1070.50 (1.46%) |
1055.70 |
1055.70 - 1070.50 |
0.02 times |
DMA SMA EMA moving averages of 734irfc2028 961756
DMA (daily moving average) of 734irfc2028 961756
| DMA period | DMA value | | 5 day DMA | 1076.52 | | 12 day DMA | 1087.12 | | 20 day DMA | 1087.11 | | 35 day DMA | 1078.68 | | 50 day DMA | 1078.27 | | 100 day DMA | 1089.62 | | 150 day DMA | 1097.2 | | 200 day DMA | 1118.4 | EMA (exponential moving average) of 734irfc2028 961756
| EMA period | EMA current | EMA prev | EMA prev2 | | 5 day EMA | 1066.26 | 1078.22 | 1101.28 | | 12 day EMA | 1079.67 | 1086.46 | 1096.34 | | 20 day EMA | 1082.09 | 1086.27 | 1091.97 | | 35 day EMA | 1082.84 | 1085.22 | 1088.35 | | 50 day EMA | 1080.03 | 1081.57 | 1083.59 |
SMA (simple moving average) of 734irfc2028 961756
| SMA period | SMA current | SMA prev | SMA prev2 | | 5 day SMA | 1076.52 | 1088.47 | 1101.25 | | 12 day SMA | 1087.12 | 1091.1 | 1095.72 | | 20 day SMA | 1087.11 | 1089.04 | 1090.78 | | 35 day SMA | 1078.68 | 1079.3 | 1080.21 | | 50 day SMA | 1078.27 | 1079.56 | 1081.04 | | 100 day SMA | 1089.62 | 1090 | 1090.62 | | 150 day SMA | 1097.2 | 1097.83 | 1098.45 | | 200 day SMA | 1118.4 | 1119.17 | 1119.99 |
|
|
