740iifcl33 961754 full analysis,charts,indicators,moving averages,SMA,DMA,EMA,ADX,MACD,RSI740iifcl33 961754 WideScreen charts, DMA,SMA,EMA technical analysis, forecast prediction, by indicators ADX,MACD,RSI,CCI BSE stock exchange
Daily price and charts and targets 740iifcl33 Strong Daily Stock price targets for 740iifcl33 961754 are 1140 and 1140 | Daily Target 1 | 1140 | | Daily Target 2 | 1140 | | Daily Target 3 | 1140 | | Daily Target 4 | 1140 | | Daily Target 5 | 1140 |
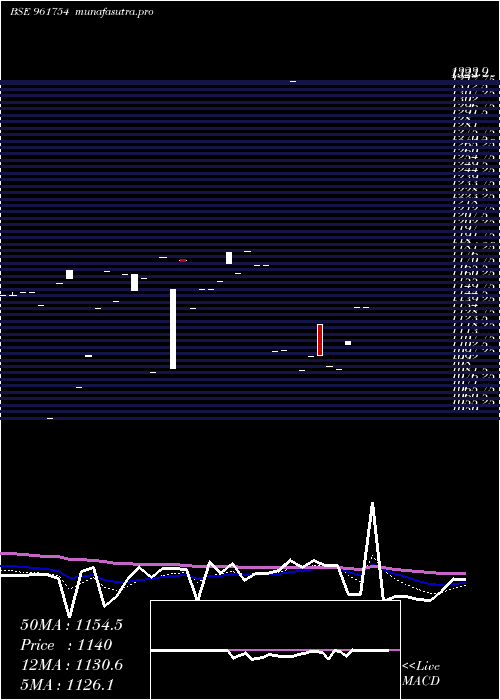
Daily price and volume 740iifcl33
| Date |
Closing |
Open |
Range |
Volume |
Wed 09 April 2025 |
1140.00 (0%) |
1140.00 |
1140.00 - 1140.00 |
0.0123 times |
Tue 08 April 2025 |
1140.00 (2.52%) |
1139.99 |
1139.99 - 1140.00 |
1.9741 times |
Tue 01 April 2025 |
1112.00 (2.06%) |
1110.01 |
1110.01 - 1112.00 |
2.3702 times |
Fri 21 February 2025 |
1089.52 (-0.23%) |
1089.52 |
1089.52 - 1089.52 |
0.0021 times |
Tue 11 February 2025 |
1092.01 (-0.82%) |
1092.01 |
1092.01 - 1092.01 |
2.0521 times |
Mon 10 February 2025 |
1101.00 (0.09%) |
1125.98 |
1101.00 - 1125.98 |
2.8258 times |
Fri 07 February 2025 |
1100.00 (1%) |
1100.00 |
1100.00 - 1100.00 |
0.2052 times |
Thu 06 February 2025 |
1089.13 (-17.73%) |
1089.13 |
1089.13 - 1089.13 |
0.0103 times |
Tue 28 January 2025 |
1323.90 (19.81%) |
1323.90 |
1323.90 - 1323.90 |
0.1375 times |
Mon 20 January 2025 |
1105.00 (0.09%) |
1105.00 |
1105.00 - 1105.00 |
0.4104 times |
Fri 10 January 2025 |
1104.01 (-5.96%) |
1104.01 |
1104.01 - 1104.01 |
0.0882 times |
Weekly price and charts 740iifcl33 Strong weekly Stock price targets for 740iifcl33 961754 are 1140 and 1140.01 | Weekly Target 1 | 1139.99 | | Weekly Target 2 | 1139.99 | | Weekly Target 3 | 1139.9966666667 | | Weekly Target 4 | 1140 | | Weekly Target 5 | 1140.01 |
Weekly price and volumes for 740iifcl33
| Date |
Closing |
Open |
Range |
Volume |
Wed 09 April 2025 |
1140.00 (2.52%) |
1139.99 |
1139.99 - 1140.00 |
1.3746 times |
Tue 01 April 2025 |
1112.00 (2.06%) |
1110.01 |
1110.01 - 1112.00 |
1.6402 times |
Fri 21 February 2025 |
1089.52 (-0.95%) |
1125.98 |
1089.52 - 1125.98 |
3.3769 times |
Fri 07 February 2025 |
1100.00 (-0.36%) |
1105.00 |
1089.13 - 1323.90 |
0.5283 times |
Fri 10 January 2025 |
1104.01 (-5.96%) |
1104.01 |
1104.01 - 1104.01 |
0.0611 times |
Fri 20 December 2024 |
1174.01 (0.5%) |
1186.00 |
1174.01 - 1186.00 |
1.4769 times |
Mon 25 November 2024 |
1168.14 (-1.42%) |
1168.14 |
1168.14 - 1168.14 |
0.284 times |
Thu 21 November 2024 |
1185.00 (2.62%) |
1161.00 |
1161.00 - 1185.00 |
0.8662 times |
Wed 16 October 2024 |
1154.79 (0%) |
1154.79 |
1154.79 - 1154.79 |
0.0014 times |
Fri 11 October 2024 |
1154.79 (-2.01%) |
1139.18 |
1139.18 - 1154.79 |
0.3905 times |
Fri 27 September 2024 |
1178.50 (1.3%) |
1087.00 |
1087.00 - 1180.69 |
36.8375 times |

Monthly price and charts 740iifcl33 Strong monthly Stock price targets for 740iifcl33 961754 are 1125.01 and 1155 | Monthly Target 1 | 1100.01 | | Monthly Target 2 | 1120.01 | | Monthly Target 3 | 1130.0033333333 | | Monthly Target 4 | 1150 | | Monthly Target 5 | 1159.99 |
Monthly price and volumes 740iifcl33
| Date |
Closing |
Open |
Range |
Volume |
Wed 09 April 2025 |
1140.00 (4.63%) |
1110.01 |
1110.01 - 1140.00 |
0.4696 times |
Fri 21 February 2025 |
1089.52 (-17.7%) |
1089.13 |
1089.13 - 1125.98 |
0.5493 times |
Tue 28 January 2025 |
1323.90 (12.77%) |
1104.01 |
1104.01 - 1323.90 |
0.0686 times |
Fri 20 December 2024 |
1174.01 (0.5%) |
1186.00 |
1174.01 - 1186.00 |
0.2301 times |
Mon 25 November 2024 |
1168.14 (0.61%) |
1176.01 |
1168.14 - 1185.00 |
0.1349 times |
Wed 23 October 2024 |
1161.00 (1.92%) |
1154.79 |
1154.79 - 1161.00 |
0.0666 times |
Mon 30 September 2024 |
1139.18 (-2.08%) |
1087.00 |
1087.00 - 1180.69 |
5.777 times |
Tue 11 June 2024 |
1163.43 (-0.32%) |
1154.12 |
1154.11 - 1167.18 |
0.2544 times |
Thu 25 April 2024 |
1167.18 (6.01%) |
1139.20 |
1139.20 - 1169.00 |
0.597 times |
Tue 26 March 2024 |
1101.01 (-3.6%) |
1050.00 |
1050.00 - 1169.87 |
1.8526 times |
Mon 19 February 2024 |
1142.10 (-0.69%) |
1149.87 |
1142.10 - 1152.00 |
12.9779 times |

DMA SMA EMA moving averages of 740iifcl33 961754
DMA (daily moving average) of 740iifcl33 961754
| DMA period | DMA value | | 5 day DMA | 1114.71 | | 12 day DMA | 1130.88 | | 20 day DMA | 1144.67 | | 35 day DMA | 1142.9 | | 50 day DMA | 1149.59 | | 100 day DMA | 1192.53 | | 150 day DMA | 1200.63 | | 200 day DMA | | EMA (exponential moving average) of 740iifcl33 961754
| EMA period | EMA current | EMA prev | EMA prev2 | | 5 day EMA | 1126.1 | 1119.15 | 1108.73 | | 12 day EMA | 1130.57 | 1128.86 | 1126.83 | | 20 day EMA | 1137.35 | 1137.07 | 1136.76 | | 35 day EMA | 1145.69 | 1146.03 | 1146.38 | | 50 day EMA | 1150.9 | 1151.34 | 1151.8 |
SMA (simple moving average) of 740iifcl33 961754
| SMA period | SMA current | SMA prev | SMA prev2 | | 5 day SMA | 1114.71 | 1106.91 | 1098.91 | | 12 day SMA | 1130.88 | 1133.72 | 1137.55 | | 20 day SMA | 1144.67 | 1146.6 | 1147.35 | | 35 day SMA | 1142.9 | 1142.96 | 1143.31 | | 50 day SMA | 1149.59 | 1150.43 | 1150.83 | | 100 day SMA | 1192.53 | 1194.13 | 1196.23 | | 150 day SMA | 1200.63 | 1200.87 | 1201.29 | | 200 day SMA |
|
|
