810irfc2327 961732 full analysis,charts,indicators,moving averages,SMA,DMA,EMA,ADX,MACD,RSI810irfc2327 961732 WideScreen charts, DMA,SMA,EMA technical analysis, forecast prediction, by indicators ADX,MACD,RSI,CCI BSE stock exchange
Daily price and charts and targets 810irfc2327 Strong Daily Stock price targets for 810irfc2327 961732 are 1053.92 and 1053.92 | Daily Target 1 | 1053.92 | | Daily Target 2 | 1053.92 | | Daily Target 3 | 1053.92 | | Daily Target 4 | 1053.92 | | Daily Target 5 | 1053.92 |
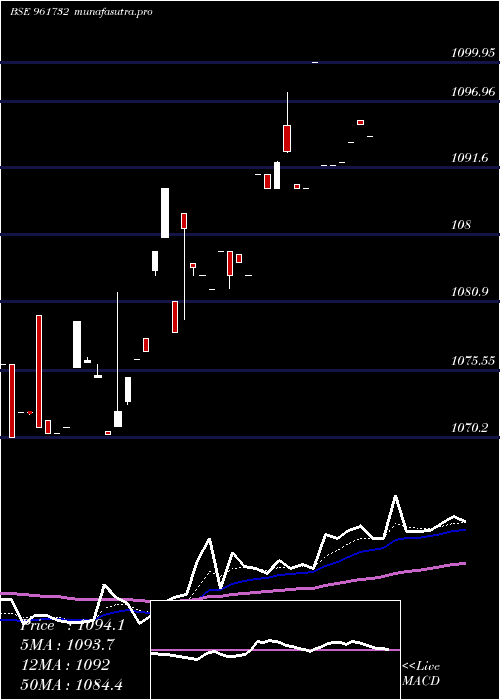
Daily price and volume 810irfc2327
| Date |
Closing |
Open |
Range |
Volume |
Fri 05 December 2025 |
1053.92 (1.34%) |
1053.92 |
1053.92 - 1053.92 |
0.3123 times |
Thu 04 December 2025 |
1040.00 (-0.05%) |
1040.00 |
1040.00 - 1040.00 |
1.5615 times |
Wed 03 December 2025 |
1040.50 (-0.24%) |
1038.01 |
1038.01 - 1042.00 |
5.7308 times |
Fri 28 November 2025 |
1043.05 (0%) |
1043.05 |
1043.05 - 1043.05 |
0.0625 times |
Thu 27 November 2025 |
1043.00 (0.08%) |
1043.00 |
1043.00 - 1043.00 |
0.3123 times |
Wed 26 November 2025 |
1042.20 (0%) |
1043.00 |
1042.20 - 1043.00 |
0.1437 times |
Tue 25 November 2025 |
1042.20 (0.02%) |
1042.20 |
1042.20 - 1042.20 |
0.0312 times |
Thu 20 November 2025 |
1042.00 (0%) |
1041.00 |
1041.00 - 1042.00 |
0.6246 times |
Tue 18 November 2025 |
1041.99 (0.19%) |
1037.60 |
1037.55 - 1042.00 |
0.9369 times |
Fri 14 November 2025 |
1040.00 (0.1%) |
1038.20 |
1038.20 - 1040.00 |
0.2842 times |
Wed 12 November 2025 |
1039.00 (0.27%) |
1037.60 |
1037.52 - 1039.00 |
1.1274 times |
Weekly price and charts 810irfc2327 Strong weekly Stock price targets for 810irfc2327 961732 are 1045.97 and 1061.88 | Weekly Target 1 | 1032.71 | | Weekly Target 2 | 1043.31 | | Weekly Target 3 | 1048.6166666667 | | Weekly Target 4 | 1059.22 | | Weekly Target 5 | 1064.53 |
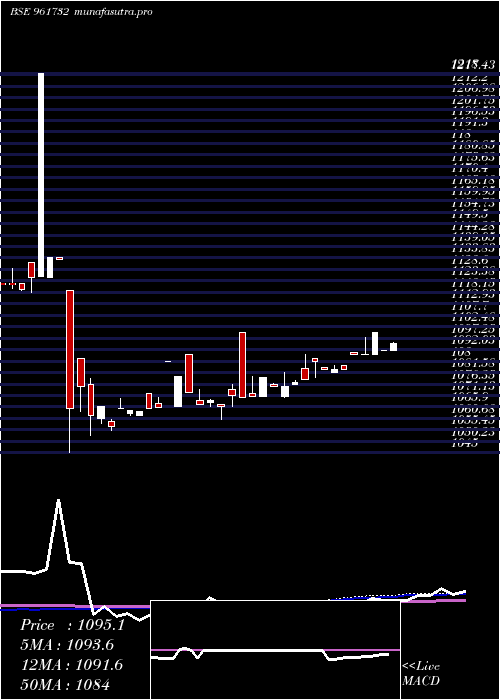
Weekly price and volumes for 810irfc2327
| Date |
Closing |
Open |
Range |
Volume |
Fri 05 December 2025 |
1053.92 (1.04%) |
1038.01 |
1038.01 - 1053.92 |
0.7676 times |
Fri 28 November 2025 |
1043.05 (0.1%) |
1042.20 |
1042.20 - 1043.05 |
0.0555 times |
Thu 20 November 2025 |
1042.00 (0.19%) |
1037.60 |
1037.55 - 1042.00 |
0.1576 times |
Fri 14 November 2025 |
1040.00 (-0.67%) |
1036.17 |
1036.17 - 1040.00 |
0.4568 times |
Thu 30 October 2025 |
1047.00 (1.16%) |
1049.90 |
1044.00 - 1133.20 |
0.1762 times |
Wed 15 October 2025 |
1035.00 (0.29%) |
1031.50 |
1031.41 - 1035.74 |
0.9763 times |
Fri 10 October 2025 |
1032.00 (-0.19%) |
1029.00 |
1028.59 - 1032.00 |
0.715 times |
Fri 03 October 2025 |
1034.00 (-6.87%) |
1110.00 |
1029.01 - 1110.00 |
2.5087 times |
Fri 26 September 2025 |
1110.30 (0.12%) |
1109.02 |
1105.00 - 1115.00 |
3.0011 times |
Fri 19 September 2025 |
1109.02 (0.31%) |
1123.93 |
1107.60 - 1123.93 |
1.1853 times |
Fri 12 September 2025 |
1105.60 (0.01%) |
1111.00 |
1105.60 - 1122.40 |
0.0697 times |
Monthly price and charts 810irfc2327 Strong monthly Stock price targets for 810irfc2327 961732 are 1045.97 and 1061.88 | Monthly Target 1 | 1032.71 | | Monthly Target 2 | 1043.31 | | Monthly Target 3 | 1048.6166666667 | | Monthly Target 4 | 1059.22 | | Monthly Target 5 | 1064.53 |
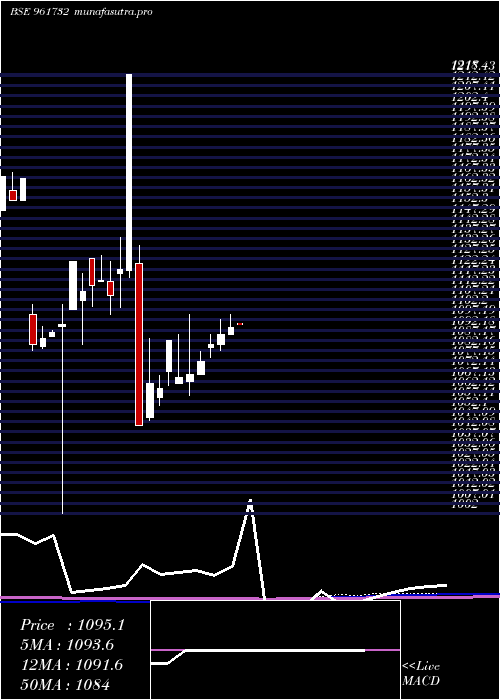
Monthly price and volumes 810irfc2327
| Date |
Closing |
Open |
Range |
Volume |
Fri 05 December 2025 |
1053.92 (1.04%) |
1038.01 |
1038.01 - 1053.92 |
0.2921 times |
Fri 28 November 2025 |
1043.05 (-0.38%) |
1036.17 |
1036.17 - 1043.05 |
0.2549 times |
Thu 30 October 2025 |
1047.00 (1.7%) |
1029.53 |
1028.59 - 1133.20 |
0.8536 times |
Tue 30 September 2025 |
1029.53 (-6.87%) |
1111.00 |
1029.01 - 1123.93 |
2.4311 times |
Fri 29 August 2025 |
1105.44 (0.67%) |
1098.30 |
1098.10 - 1114.90 |
1.4423 times |
Tue 29 July 2025 |
1098.10 (0.4%) |
1095.35 |
1094.10 - 1104.99 |
0.1796 times |
Thu 26 June 2025 |
1093.70 (0.34%) |
1090.00 |
1090.00 - 1099.95 |
0.0681 times |
Thu 29 May 2025 |
1090.00 (0.46%) |
1085.00 |
1082.00 - 1097.50 |
1.1249 times |
Wed 30 April 2025 |
1085.00 (0.74%) |
1083.40 |
1078.60 - 1090.00 |
0.5403 times |
Fri 28 March 2025 |
1077.00 (0.61%) |
1070.50 |
1070.40 - 1081.70 |
2.8131 times |
Fri 28 February 2025 |
1070.50 (0.14%) |
1067.00 |
1060.10 - 1100.00 |
3.1132 times |
DMA SMA EMA moving averages of 810irfc2327 961732
DMA (daily moving average) of 810irfc2327 961732
| DMA period | DMA value | | 5 day DMA | 1044.09 | | 12 day DMA | 1042 | | 20 day DMA | 1040.86 | | 35 day DMA | 1062.13 | | 50 day DMA | 1074.32 | | 100 day DMA | 1076.83 | | 150 day DMA | 1079.67 | | 200 day DMA | 1088.78 | EMA (exponential moving average) of 810irfc2327 961732
| EMA period | EMA current | EMA prev | EMA prev2 | | 5 day EMA | 1045.45 | 1041.21 | 1041.82 | | 12 day EMA | 1044.31 | 1042.56 | 1043.02 | | 20 day EMA | 1047.88 | 1047.24 | 1048 | | 35 day EMA | 1059.1 | 1059.41 | 1060.55 | | 50 day EMA | 1072.87 | 1073.64 | 1075.01 |
SMA (simple moving average) of 810irfc2327 961732
| SMA period | SMA current | SMA prev | SMA prev2 | | 5 day SMA | 1044.09 | 1041.75 | 1042.19 | | 12 day SMA | 1042 | 1041.43 | 1042.01 | | 20 day SMA | 1040.86 | 1039.63 | 1039.33 | | 35 day SMA | 1062.13 | 1063.76 | 1065.63 | | 50 day SMA | 1074.32 | 1075.14 | 1076.22 | | 100 day SMA | 1076.83 | 1076.95 | 1077.23 | | 150 day SMA | 1079.67 | 1080.13 | 1080.68 | | 200 day SMA | 1088.78 | 1089.11 | 1089.42 |
|
|
