Mfcl9 940457 full analysis,charts,indicators,moving averages,SMA,DMA,EMA,ADX,MACD,RSIMfcl 9 940457 WideScreen charts, DMA,SMA,EMA technical analysis, forecast prediction, by indicators ADX,MACD,RSI,CCI BSE stock exchange
Daily price and charts and targets Mfcl9 Strong Daily Stock price targets for Mfcl9 940457 are 1003.05 and 1003.05 | Daily Target 1 | 1003.05 | | Daily Target 2 | 1003.05 | | Daily Target 3 | 1003.05 | | Daily Target 4 | 1003.05 | | Daily Target 5 | 1003.05 |
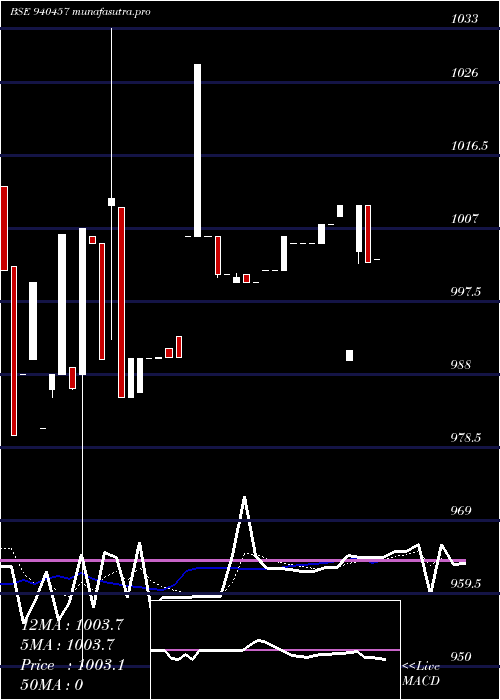
Daily price and volume Mfcl 9
| Date |
Closing |
Open |
Range |
Volume |
Thu 23 October 2025 |
1003.05 (0.04%) |
1003.05 |
1003.05 - 1003.05 |
0.2405 times |
Tue 21 October 2025 |
1002.60 (-0.73%) |
1010.00 |
1002.60 - 1010.00 |
0.5842 times |
Mon 20 October 2025 |
1010.00 (1.91%) |
1004.00 |
1002.50 - 1010.00 |
0.4811 times |
Thu 16 October 2025 |
991.10 (-1.87%) |
989.80 |
989.80 - 991.10 |
2.4399 times |
Wed 15 October 2025 |
1010.00 (0.25%) |
1008.60 |
1008.60 - 1010.00 |
1.4777 times |
Tue 14 October 2025 |
1007.51 (0%) |
1007.51 |
1007.51 - 1007.51 |
0.4811 times |
Fri 10 October 2025 |
1007.51 (0.25%) |
1005.01 |
1005.01 - 1007.51 |
1.9588 times |
Wed 08 October 2025 |
1005.01 (0%) |
1005.01 |
1005.01 - 1005.01 |
1.0997 times |
Wed 01 October 2025 |
1005.01 (0%) |
1005.01 |
1005.01 - 1005.01 |
0.2405 times |
Mon 29 September 2025 |
1005.00 (-0.1%) |
1005.00 |
1005.00 - 1005.00 |
0.9966 times |
Thu 25 September 2025 |
1006.01 (0.45%) |
1001.51 |
1001.51 - 1006.01 |
0.5842 times |
Weekly price and charts Mfcl9 Strong weekly Stock price targets for Mfcl9 940457 are 999.03 and 1006.53 | Weekly Target 1 | 997.68 | | Weekly Target 2 | 1000.37 | | Weekly Target 3 | 1005.1833333333 | | Weekly Target 4 | 1007.87 | | Weekly Target 5 | 1012.68 |
Weekly price and volumes for Mfcl 9
| Date |
Closing |
Open |
Range |
Volume |
Thu 23 October 2025 |
1003.05 (1.21%) |
1004.00 |
1002.50 - 1010.00 |
0.1787 times |
Thu 16 October 2025 |
991.10 (-1.63%) |
1007.51 |
989.80 - 1010.00 |
0.6021 times |
Fri 10 October 2025 |
1007.51 (0.25%) |
1005.01 |
1005.01 - 1007.51 |
0.4186 times |
Wed 01 October 2025 |
1005.01 (-0.1%) |
1005.00 |
1005.00 - 1005.01 |
0.1693 times |
Thu 25 September 2025 |
1006.01 (0.6%) |
1001.50 |
1001.50 - 1006.01 |
0.4892 times |
Fri 19 September 2025 |
1000.00 (-0.1%) |
1001.06 |
1000.00 - 1001.15 |
1.2747 times |
Fri 12 September 2025 |
1001.00 (-0.5%) |
1006.00 |
1000.60 - 1028.40 |
1.6322 times |
Fri 05 September 2025 |
1006.00 (1.61%) |
990.10 |
990.10 - 1006.00 |
3.6642 times |
Thu 28 August 2025 |
990.10 (0%) |
985.60 |
985.60 - 990.10 |
0.1599 times |
Fri 22 August 2025 |
990.10 (-1.69%) |
1006.00 |
985.05 - 1033.00 |
1.4111 times |
Tue 12 August 2025 |
1007.08 (2.13%) |
988.00 |
950.00 - 1007.08 |
0.7855 times |

Monthly price and charts Mfcl9 Strong monthly Stock price targets for Mfcl9 940457 are 986.33 and 1006.53 | Monthly Target 1 | 980.75 | | Monthly Target 2 | 991.9 | | Monthly Target 3 | 1000.95 | | Monthly Target 4 | 1012.1 | | Monthly Target 5 | 1021.15 |
Monthly price and volumes Mfcl 9
| Date |
Closing |
Open |
Range |
Volume |
Thu 23 October 2025 |
1003.05 (-0.19%) |
1005.01 |
989.80 - 1010.00 |
0.1179 times |
Mon 29 September 2025 |
1005.00 (1.5%) |
990.10 |
990.10 - 1028.40 |
0.6886 times |
Thu 28 August 2025 |
990.10 (0.21%) |
990.00 |
950.00 - 1033.00 |
0.8483 times |
Thu 31 July 2025 |
988.05 (0%) |
994.00 |
970.05 - 1173.66 |
2.3452 times |
Thu 23 October 2025 |
(0%) |
|
- |
0 times |

DMA SMA EMA moving averages of Mfcl 9 940457
DMA (daily moving average) of Mfcl 9 940457
| DMA period | DMA value | | 5 day DMA | 1003.35 | | 12 day DMA | 1004.53 | | 20 day DMA | 1004.64 | | 35 day DMA | 1000.52 | | 50 day DMA | | | 100 day DMA | | | 150 day DMA | | | 200 day DMA | | EMA (exponential moving average) of Mfcl 9 940457
| EMA period | EMA current | EMA prev | EMA prev2 | | 5 day EMA | 1003.66 | 1003.97 | 1004.65 | | 12 day EMA | 1003.72 | 1003.84 | 1004.06 | | 20 day EMA | 1002.94 | 1002.93 | 1002.96 | | 35 day EMA | 1000.86 | 1000.73 | 1000.62 | | 50 day EMA | 0 | 0 | 0 |
SMA (simple moving average) of Mfcl 9 940457
| SMA period | SMA current | SMA prev | SMA prev2 | | 5 day SMA | 1003.35 | 1004.24 | 1005.22 | | 12 day SMA | 1004.53 | 1004.4 | 1004.18 | | 20 day SMA | 1004.64 | 1004.79 | 1004.17 | | 35 day SMA | 1000.52 | 999.89 | 999.82 | | 50 day SMA | | 100 day SMA | | 150 day SMA | | 200 day SMA |
|
|
